Fig. 2
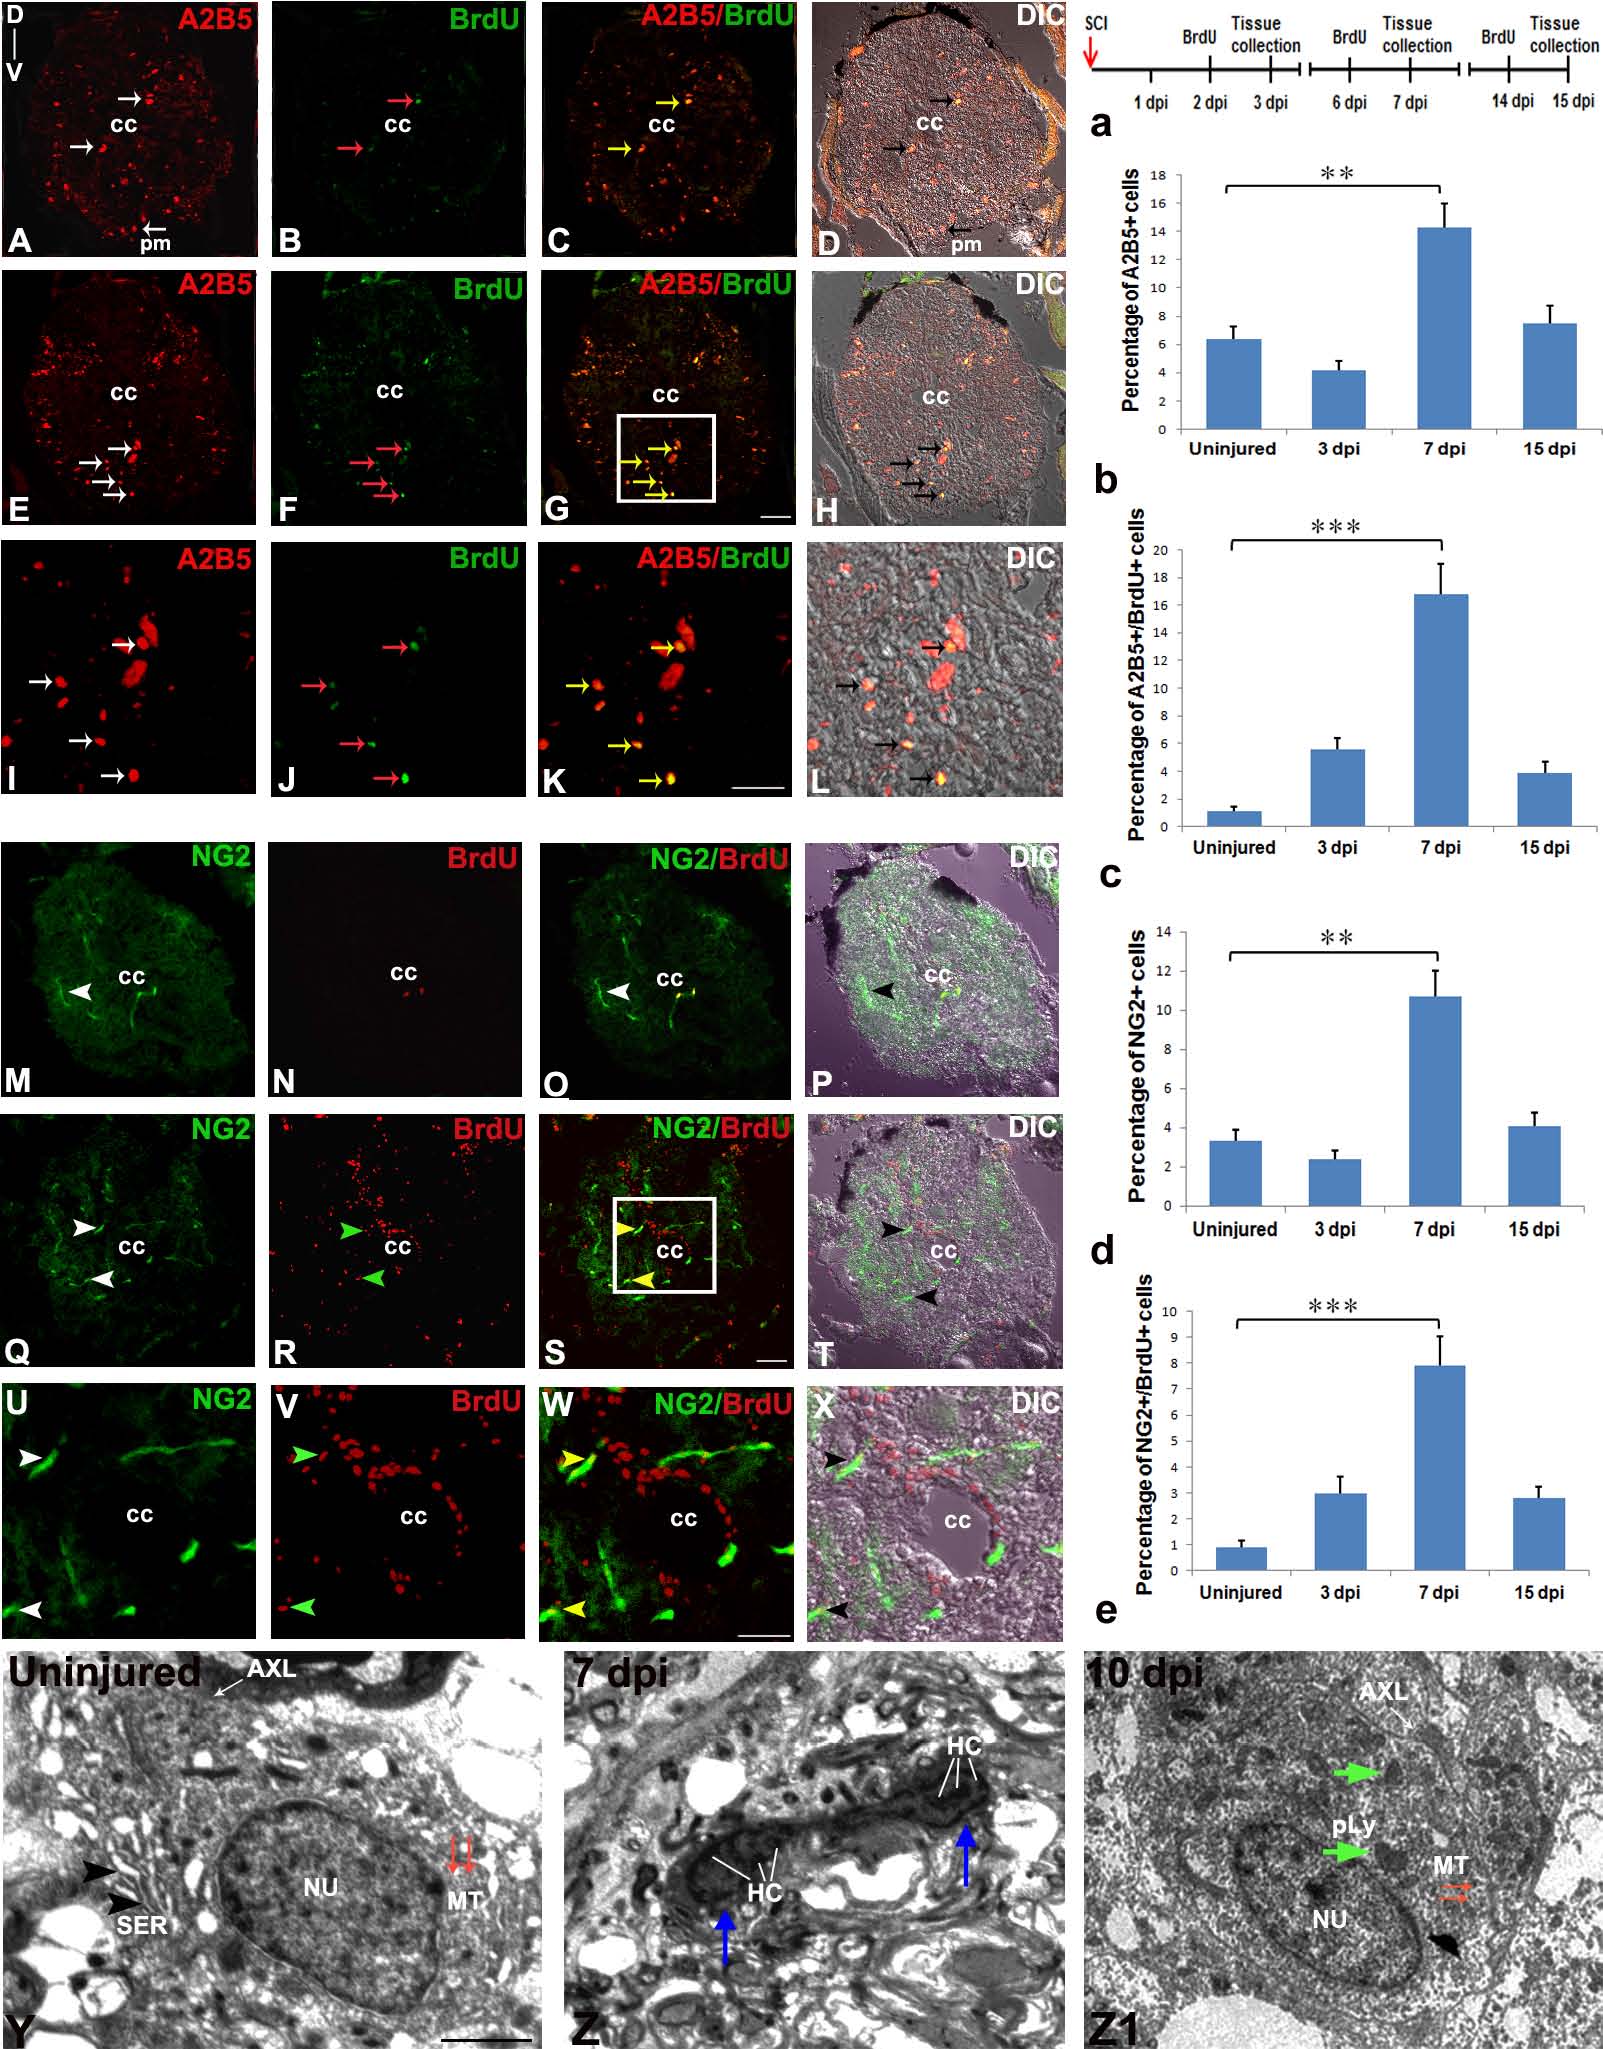
Immunohistochemical and ultrastructural analysis of glial progenitors in uninjured and injured zebrafish spinal cord: A-D) A cross section of uninjured cord showing A2B5+ cells (white arrows) in white matter and pial membrane (pm, A and D); BrdU+ cells (red arrow, B); A2B5+/BrdU+ colocalized cells (yellow arrows, C) and DIC image of section C (D). E-H) A 7 dpi cord section showing many A2B5 positive cells (white arrow) in white matter and very few in grey matter (white arrow, E); BrdU+ cells (red arrow, F); A2B5+/BrdU+ colocalized cells (yellow arrow, G) and DIC of section G (H). I-L) Higher magnification of boxed area in G showing A2B5+ cells (white arrows, I); BrdU+ cells (red arrows, J); A2B5+/BrdU+ colocalized cells (yellow arrows, K) and DIC image of section K (L). M-P) An uninjured cord section showing NG2+ bipolar cells (white arrowhead) in the white matter of the cord (M); BrdU+ positive cells (N); NG2+/BrdU+ colocalized cells (yellow arrowhead, O) and DIC image of section O (P). Q-T) A 7 dpi cord section showing many NG2+ cells (white arrowheads) in white matter (Q); BrdU+ cells (green arrowhead, R); NG2+/BrdU+ colocalized cells (yellow arrowhead, S) and DIC image of section R (T). U-X) Higher magnification of boxed area in S showing NG2+ cells (white arrowheads, U); BrdU+ cells (green arrowheads, V); NG2+/BrdU+ colocalized cells (yellow arrowheads, W) and DIC image of section W (X). Y) Ultrastructure of an uninjured cord section showing an oligodendrocyte with many cisternae (black arrowheads) of smooth endoplasmic reticulum (SER), microtubules (MT, red arrows) in the cytoplasm but no intermediate filaments. Z) A 7 dpi cord section showing a proliferating astrocyte progenitor with a prominent dumb-bell shaped compact dividing nucleus (blue arrows) with characteristic heterochromatin body (HC) in the injury site. Z1) A newly formed oligodendrocyte with small cytoplasmic area where microtubules (MT, red arrows) are obvious and a few cytoplasmic organelles (green arrows) like primary lysosome (pLY) is present at the injury site of 10 dpi cord section. Note that axolemma (AXL) is in close vicinity of the cytoplasm. ‘NU’ indicates nucleus of the cell. a) Drawing represents the time frame of SCI, BrdU treatment and tissue collection for cell proliferation experiments. b-e) Quantification of A2B5+ cells (b), A2B5+/BrdU+ cells (c), NG2+ cells (d), NG2+/BrdU+ cells (e) in uninjured, 3 dpi, 7 dpi and 15 dpi cord. The values in bar represents Mean ± s.e.m. (n = 5), statistical significance represented as p value (Student’s t-test; **p<0.01, ***p<0.001). ‘cc’ denotes central canal of the cord. Scale bar = 50 µm (A-H, M-T); 20 µm (I-L, U-X); 1 µm (Y, Z, Z1).

