
|
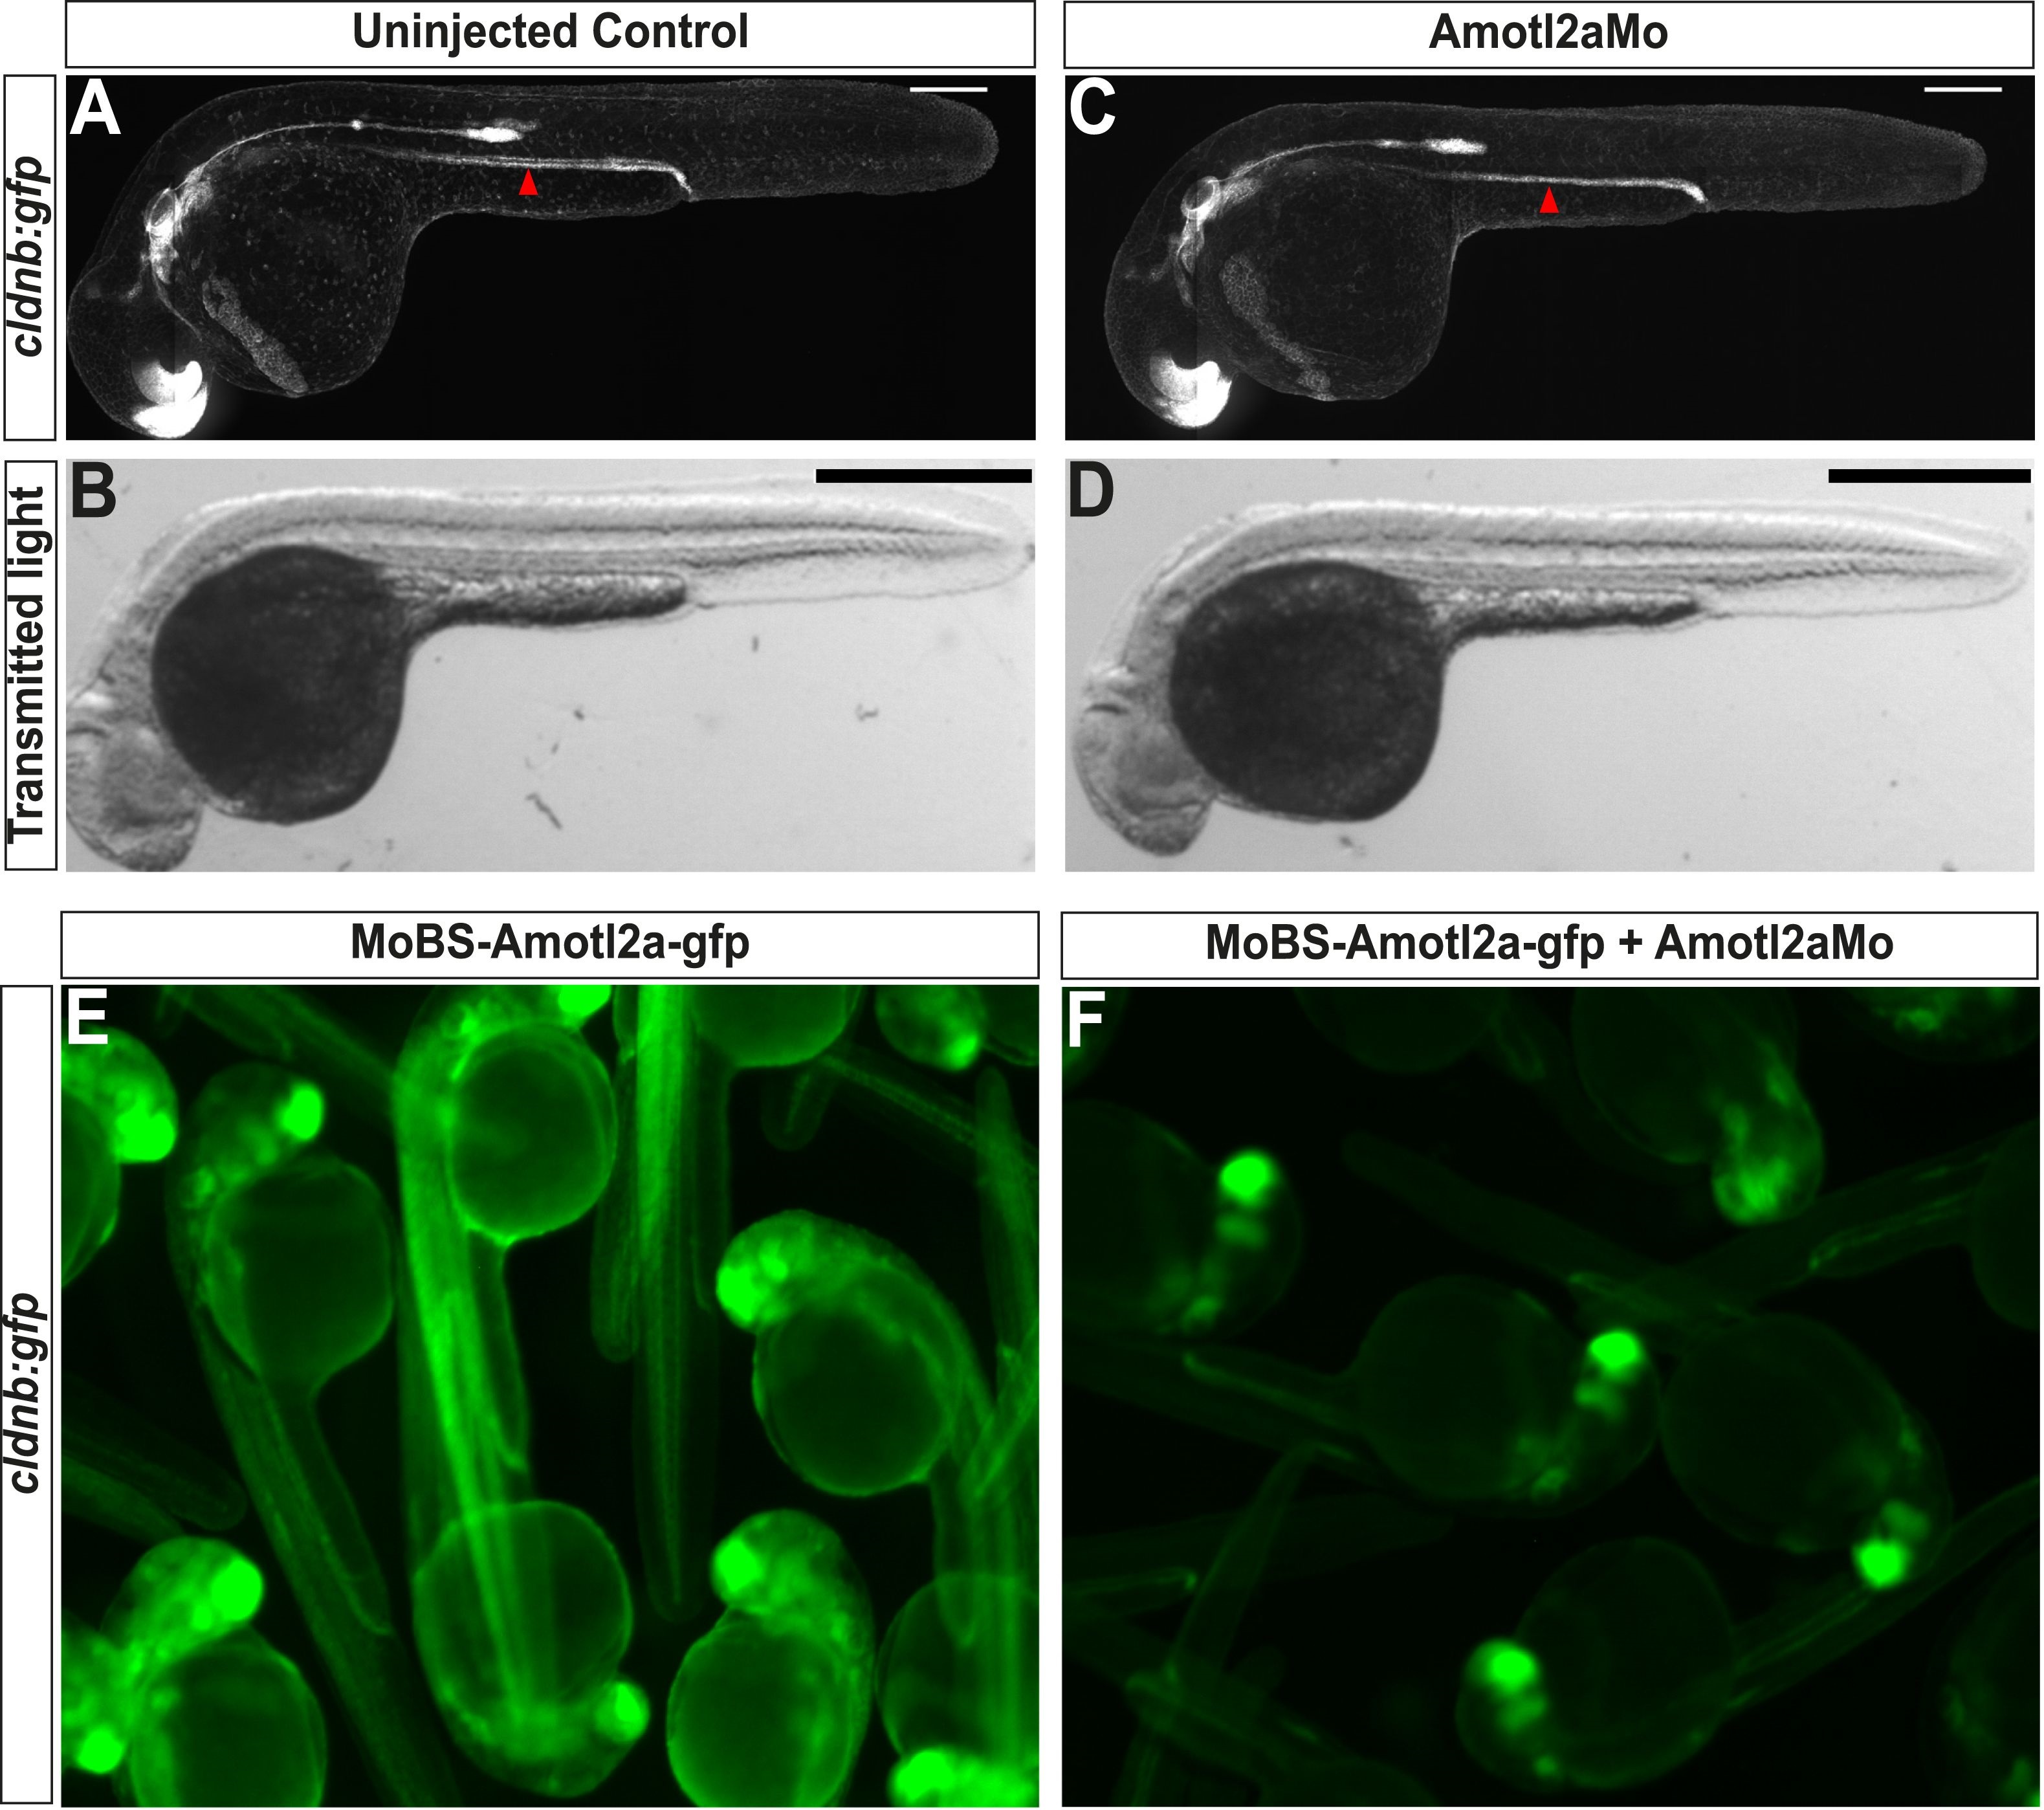
Fig. 2, S1 Amotl2aMo efficiency.
(A–D) Overview pictures of 30 hpf cldnb:gfp embryos uninjected (A, B) or injected with Amotl2aMo (C, D), imaged either with fluorescent (A–C) or transmitted light (B–D). (E, F) cldnb:gfp embryos injected with RNA encoding the Mo-binding region of Amotl2a fused to GFP (MoBS-amotl2a-gfp) either alone (E) or with Amotl2aMo (F). The bright green fluorescence in F comes from the expression of the cldnb:gfp transgene in the brain and eyes. The red arrowheads in A and C indicate the level of migration at which embryos were fixed for cell counting quantification (see ‘Materials and methods’).