Fig. 1
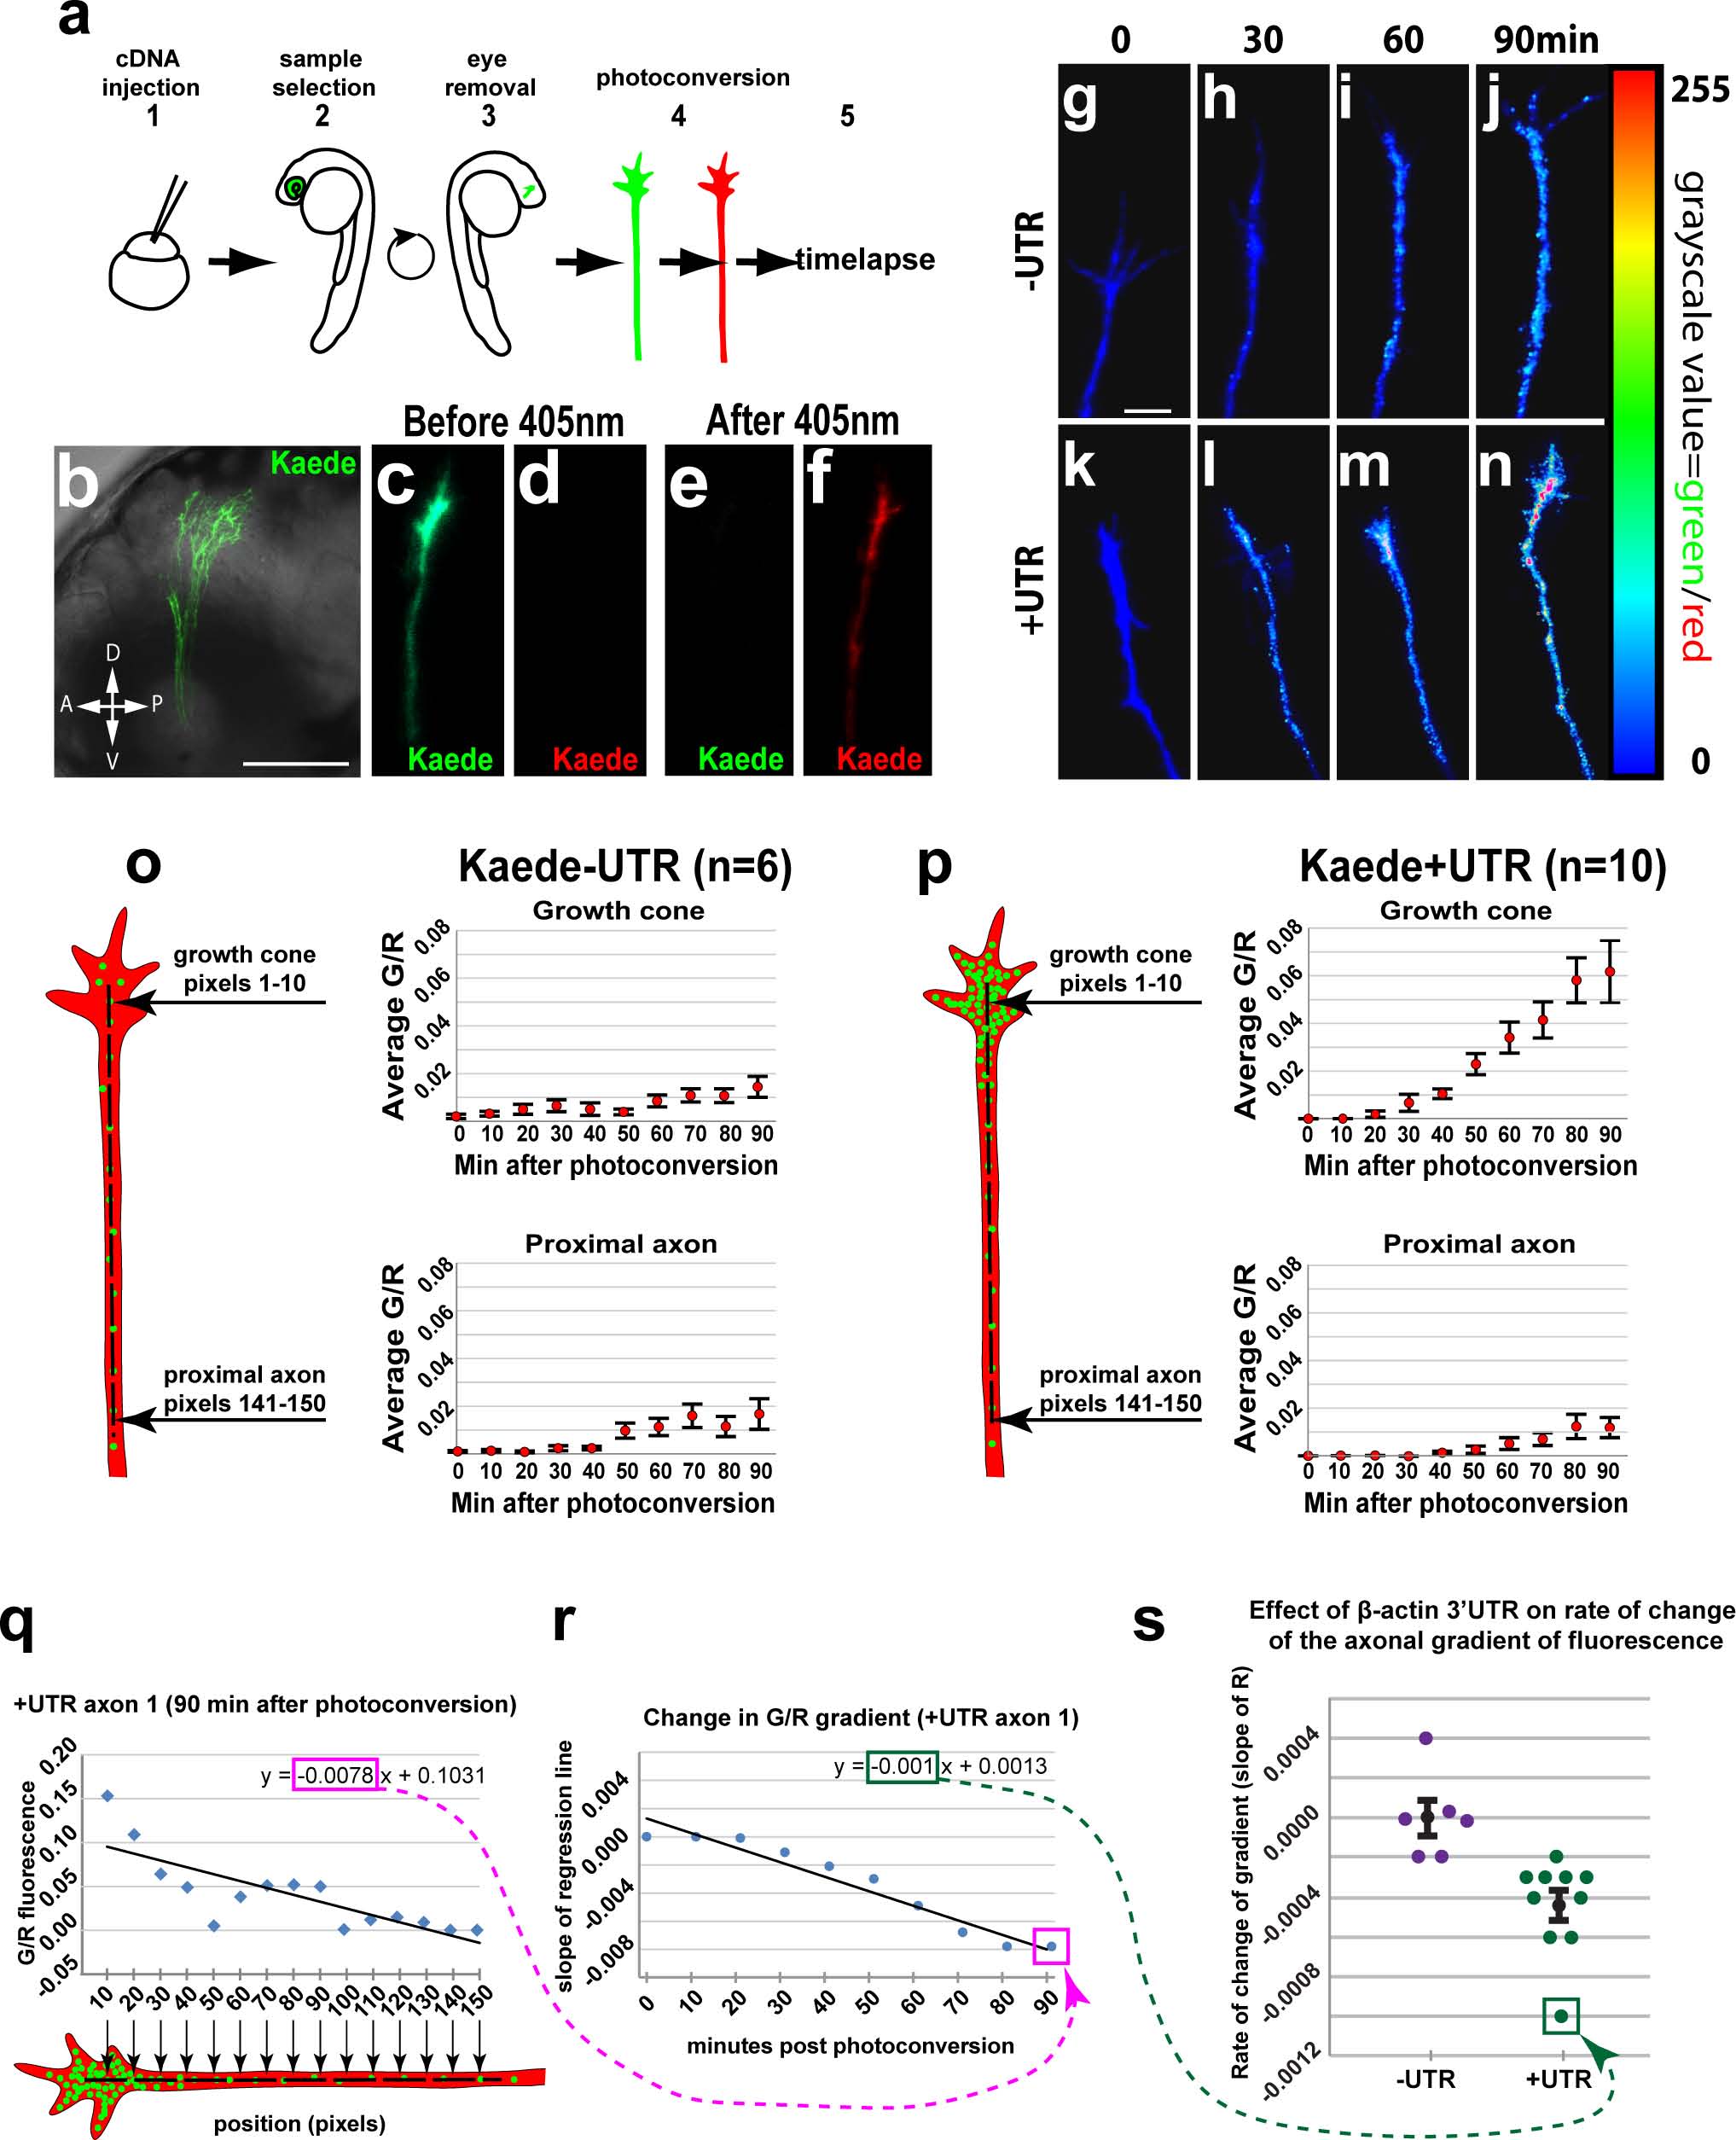
The β-actin 3′UTR is sufficient for local translation of Kaede in RGC growth cones in vivo.
(a) Steps for in vivo timelapse assay: 1- cDNA injections, 2- selection of embryos with strong Kaede expression in the eye at 2dpf, 3- dissections to remove right eye and drain yolk, 4- photoconversion of Kaede in RGC axons, 5- timelapse. (b) Confocal projection (40x water lens) of a live 3 dpf embryo with Kaede expression in RGC axons in the optic tract (green). (c-f) Confocal projections of the green and red channels of one axon before (c, d) and after photoconversion (e, f). (g-n) Confocal projection from timelapse of one–UTR axon (g-j) and one +UTR axon (k-n) with green to red fluorescence ratio represented by color map. (o, p) Average green to red fluorescence intensity ratio throughout timelapse in growth cones (pixels 1–10) and proximal regions (pixels 141–150) of–UTR (n = 6) and +UTR (n = 10) axons. A one-way ANOVA (p = 0.0012) with a Tukey HSD test (p<0.05) 90 min after photoconversion showed significantly higher green to red ratio in +UTR growth cones compared to–UTR growth cones at 90 min after photoconversion. (q) The green-to-red ratio in a representative +UTR axon (axon 1) plotted against the distance from the growth cone at a representative time (90 min) after photoconversion. The slope of a linear regression to these data (outlined with a magenta rectangle) reflects the spatial gradient of green-to-red ratio 90 minutes after photoconversion. (r) Change in spatial gradient of green-to-red ratio in representative axon 1 throughout the timelapse. The point labeled Q is the slope of the linear regression in panel q, which was determined at 90 min. The other points in this graph were similarly determined in axon 1 at 10 minute intervals throughout the timelapse assay. The slope of a linear regression to these data (outlined with a green rectangle) reflects the rate of change of the gradient of green-to-red fluorescence along axon 1. (s) Rates of change in gradients of green-to-red fluorescence in all assayed axons. The point labeled R is the slope of the linear regression in panel r, which was determined in axon 1. The rates of change of the axonal gradient for the UTR (n = 6) and +UTR (n = 10) axons were significantly different (Mann-Whitney U test, p = 0.0002). Scale bars are 100 µm (b) and 5 µm (g).

