
|
Fig. S1
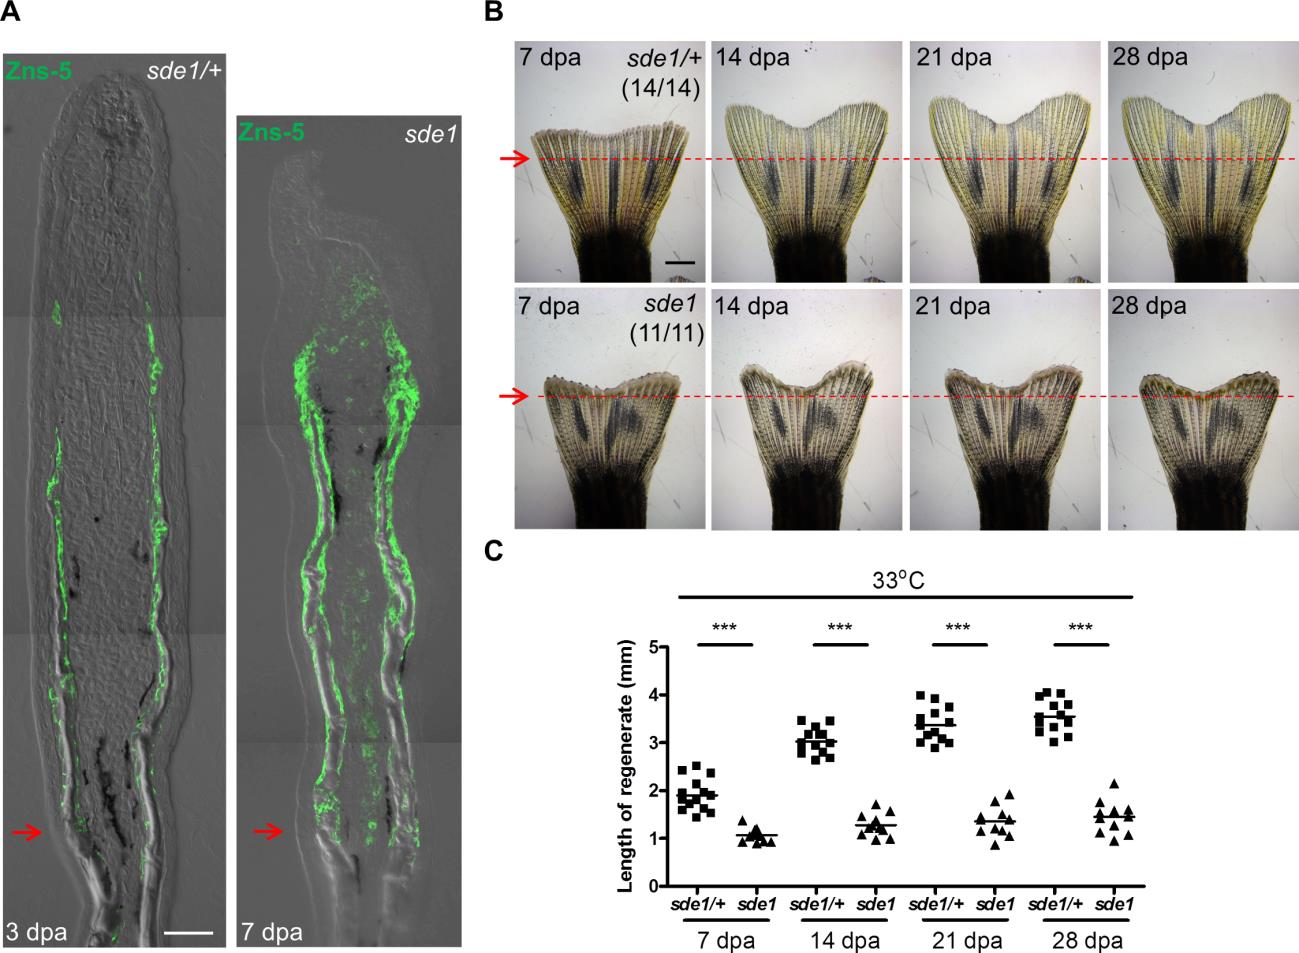
Osteoblast patterning in sde1 fin regenerates at 7 dpa.
(A) sde1 regenerates (right) are severely shortened at 7 dpa, comparable to a 3 dpa clutchmate sample (left). Osteoblasts (green) line the bone in proximal areas but accumulate in masses in distal regions. Scale bars, 50 µm. Red arrows indicate plane of amputation. (B) Whole-mount images of sde1/+ and sde1 regenerates at 7, 14, 21, and 28 dpa. Images from the same animal are shown here across different time points. Red arrows and dashed lines indicate plane of amputation. Scale bars, 1 mm. (C) Measurement of fin regenerates at different time points (n = 14 vs. 11; Student’s t -test, ***P < 0.001).