Fig. 2
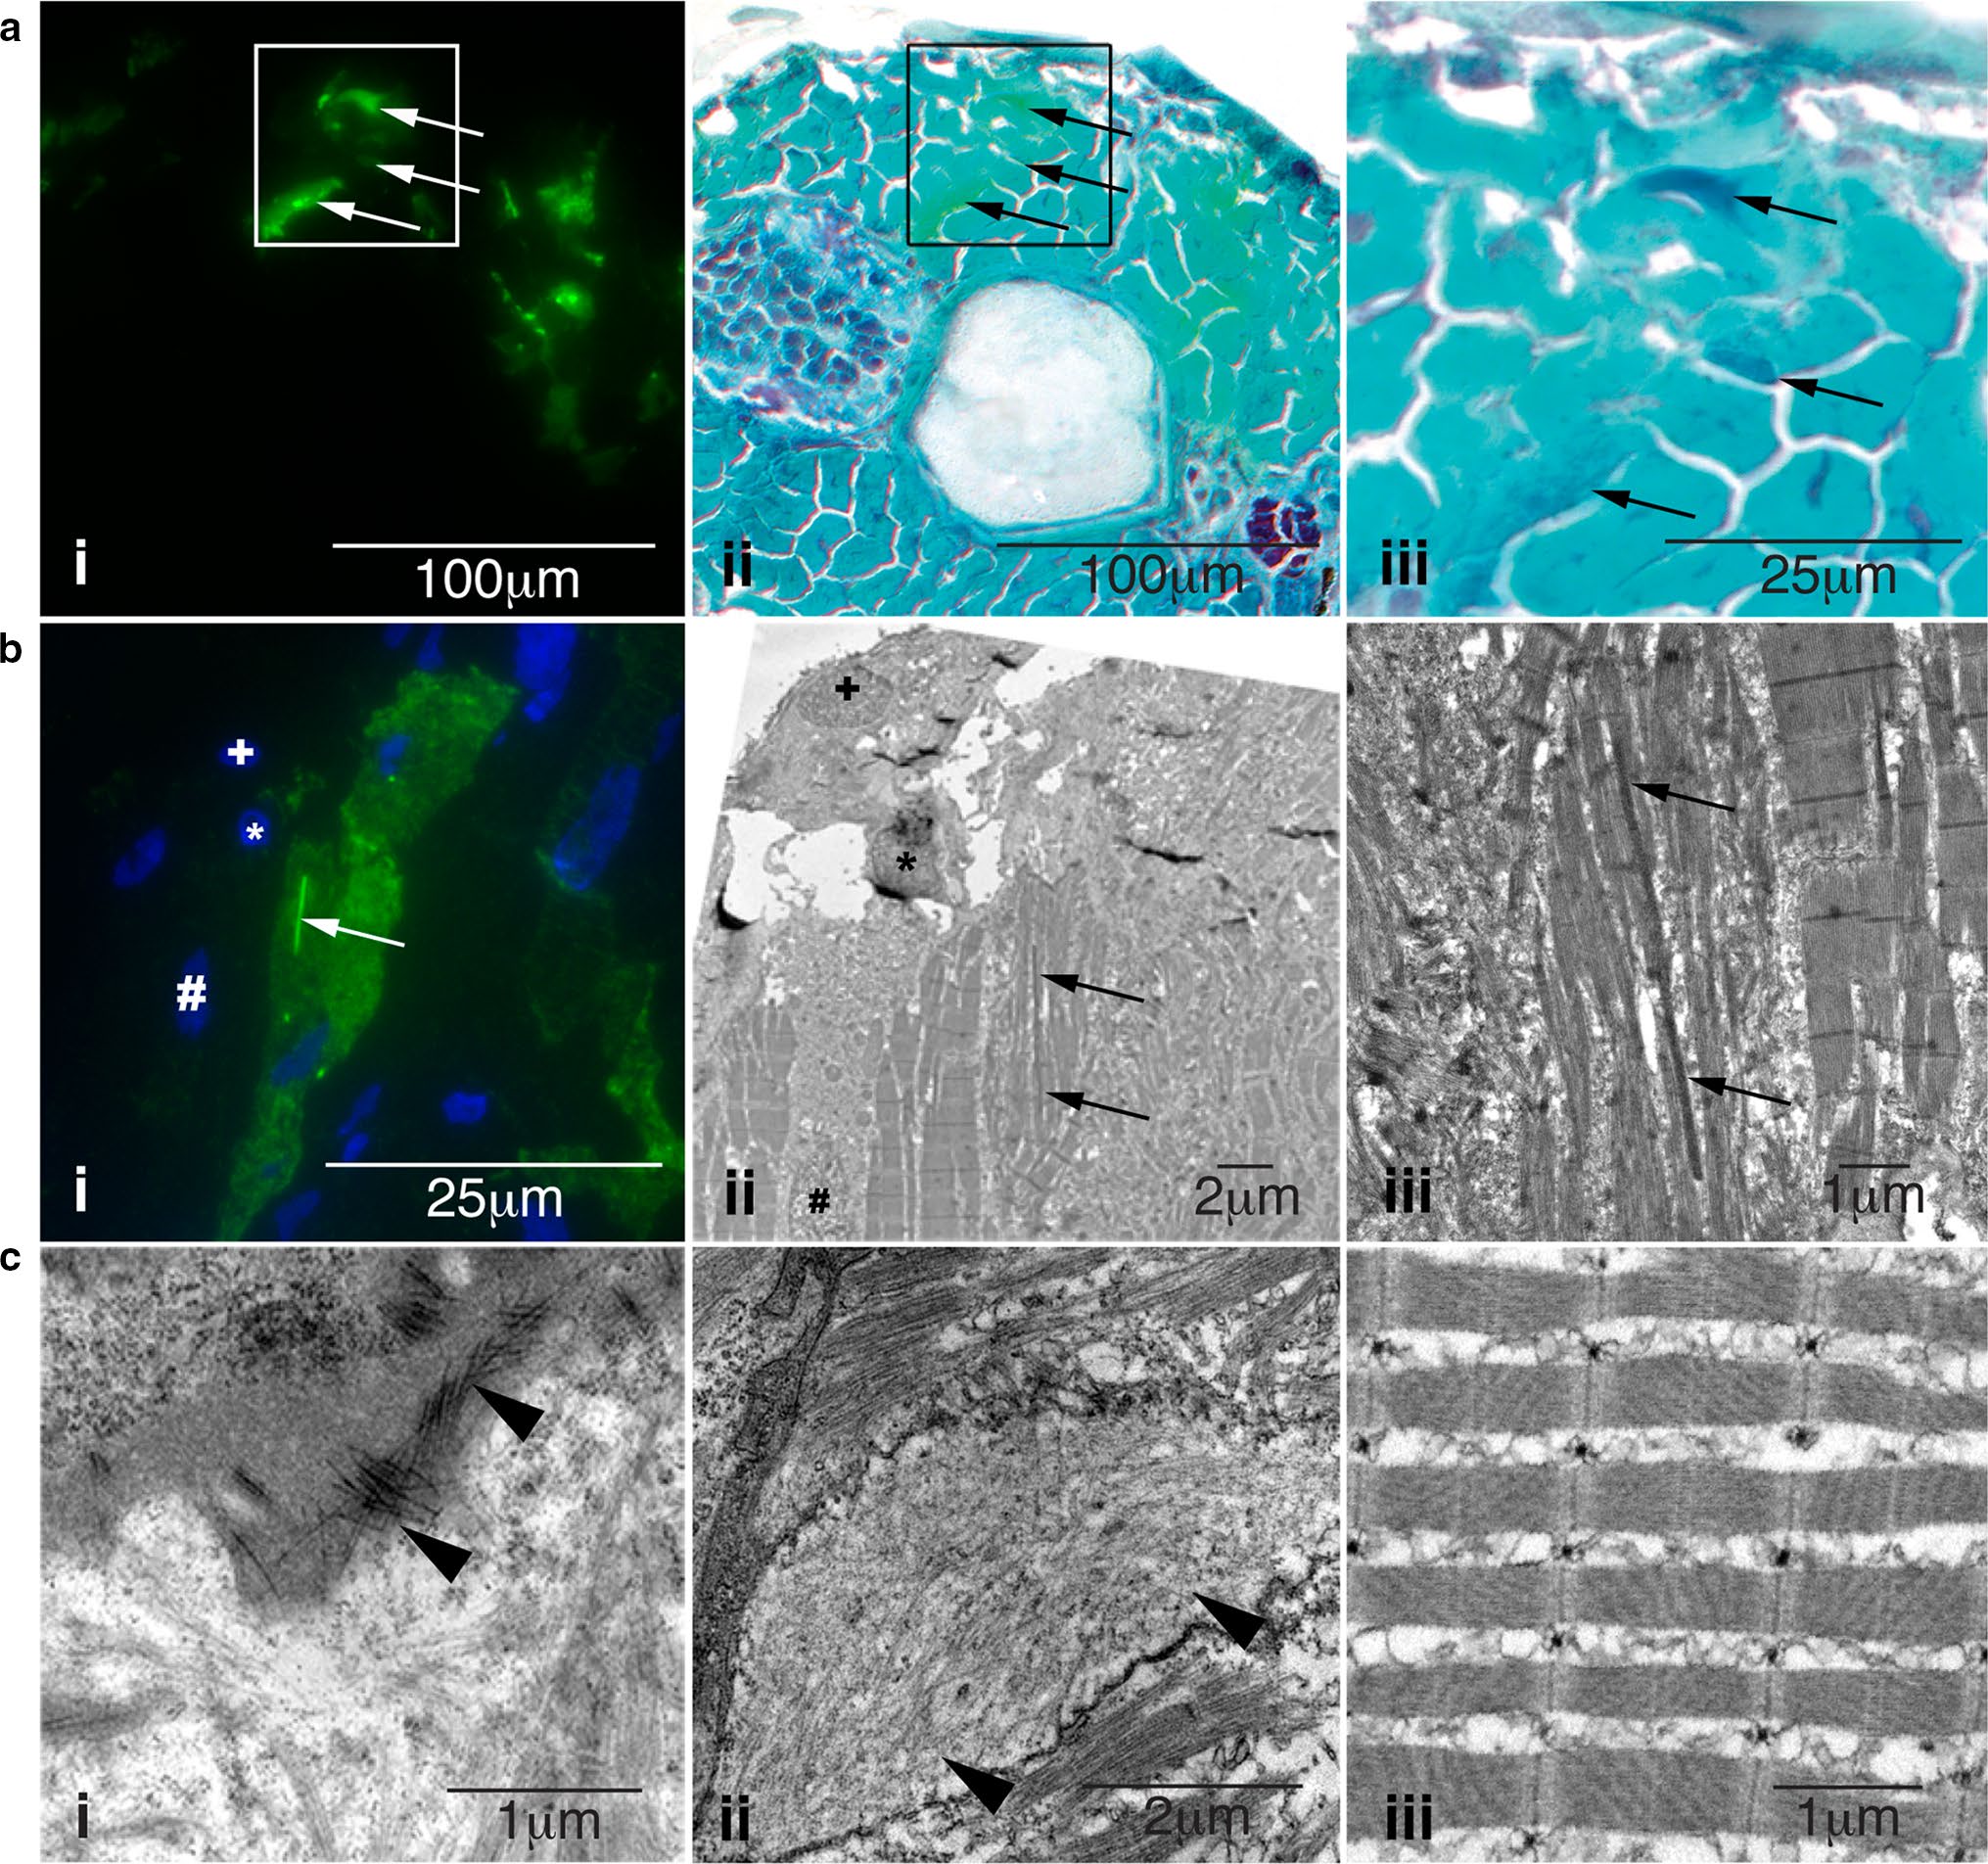
Characterization of skeletal muscle pathology in Tg(ACTA1D286G-eGFP)high zebrafish. a Skeletal muscle expressing i mosaic ACTA1D286G-eGFP, and ii overlaid with a light microscopy image of the same section showing Gomori trichrome staining, and iii enlarged. Dark regions (indicative of nemaline bodies) of disrupted muscle correspond to eGFP expression (arrows). b Correlative light and electron microscopy of Tg(ACTA1D286G-eGFP)high fish muscle at 2 dpf. b i Fluorescent image and corresponding ii electron microscopy image of skeletal muscle section containing a dense, elongated nemaline body (arrow) and enlarged in (iii). Sections are matched using nuclei positions (asterisk, plus and hash). c i Accumulations of actin filaments (arrowheads) and ii diffuse regions of filamentous actin (arrowheads), as well as ii disrupted sarcomeric regions are evident in Tg(ACTA1 D286G-eGFP)high skeletal muscle, at 2 dpf unlike the iii uniform sarcomeres observed in Tg(ACTA1-eGFP) zebrafish

