
|
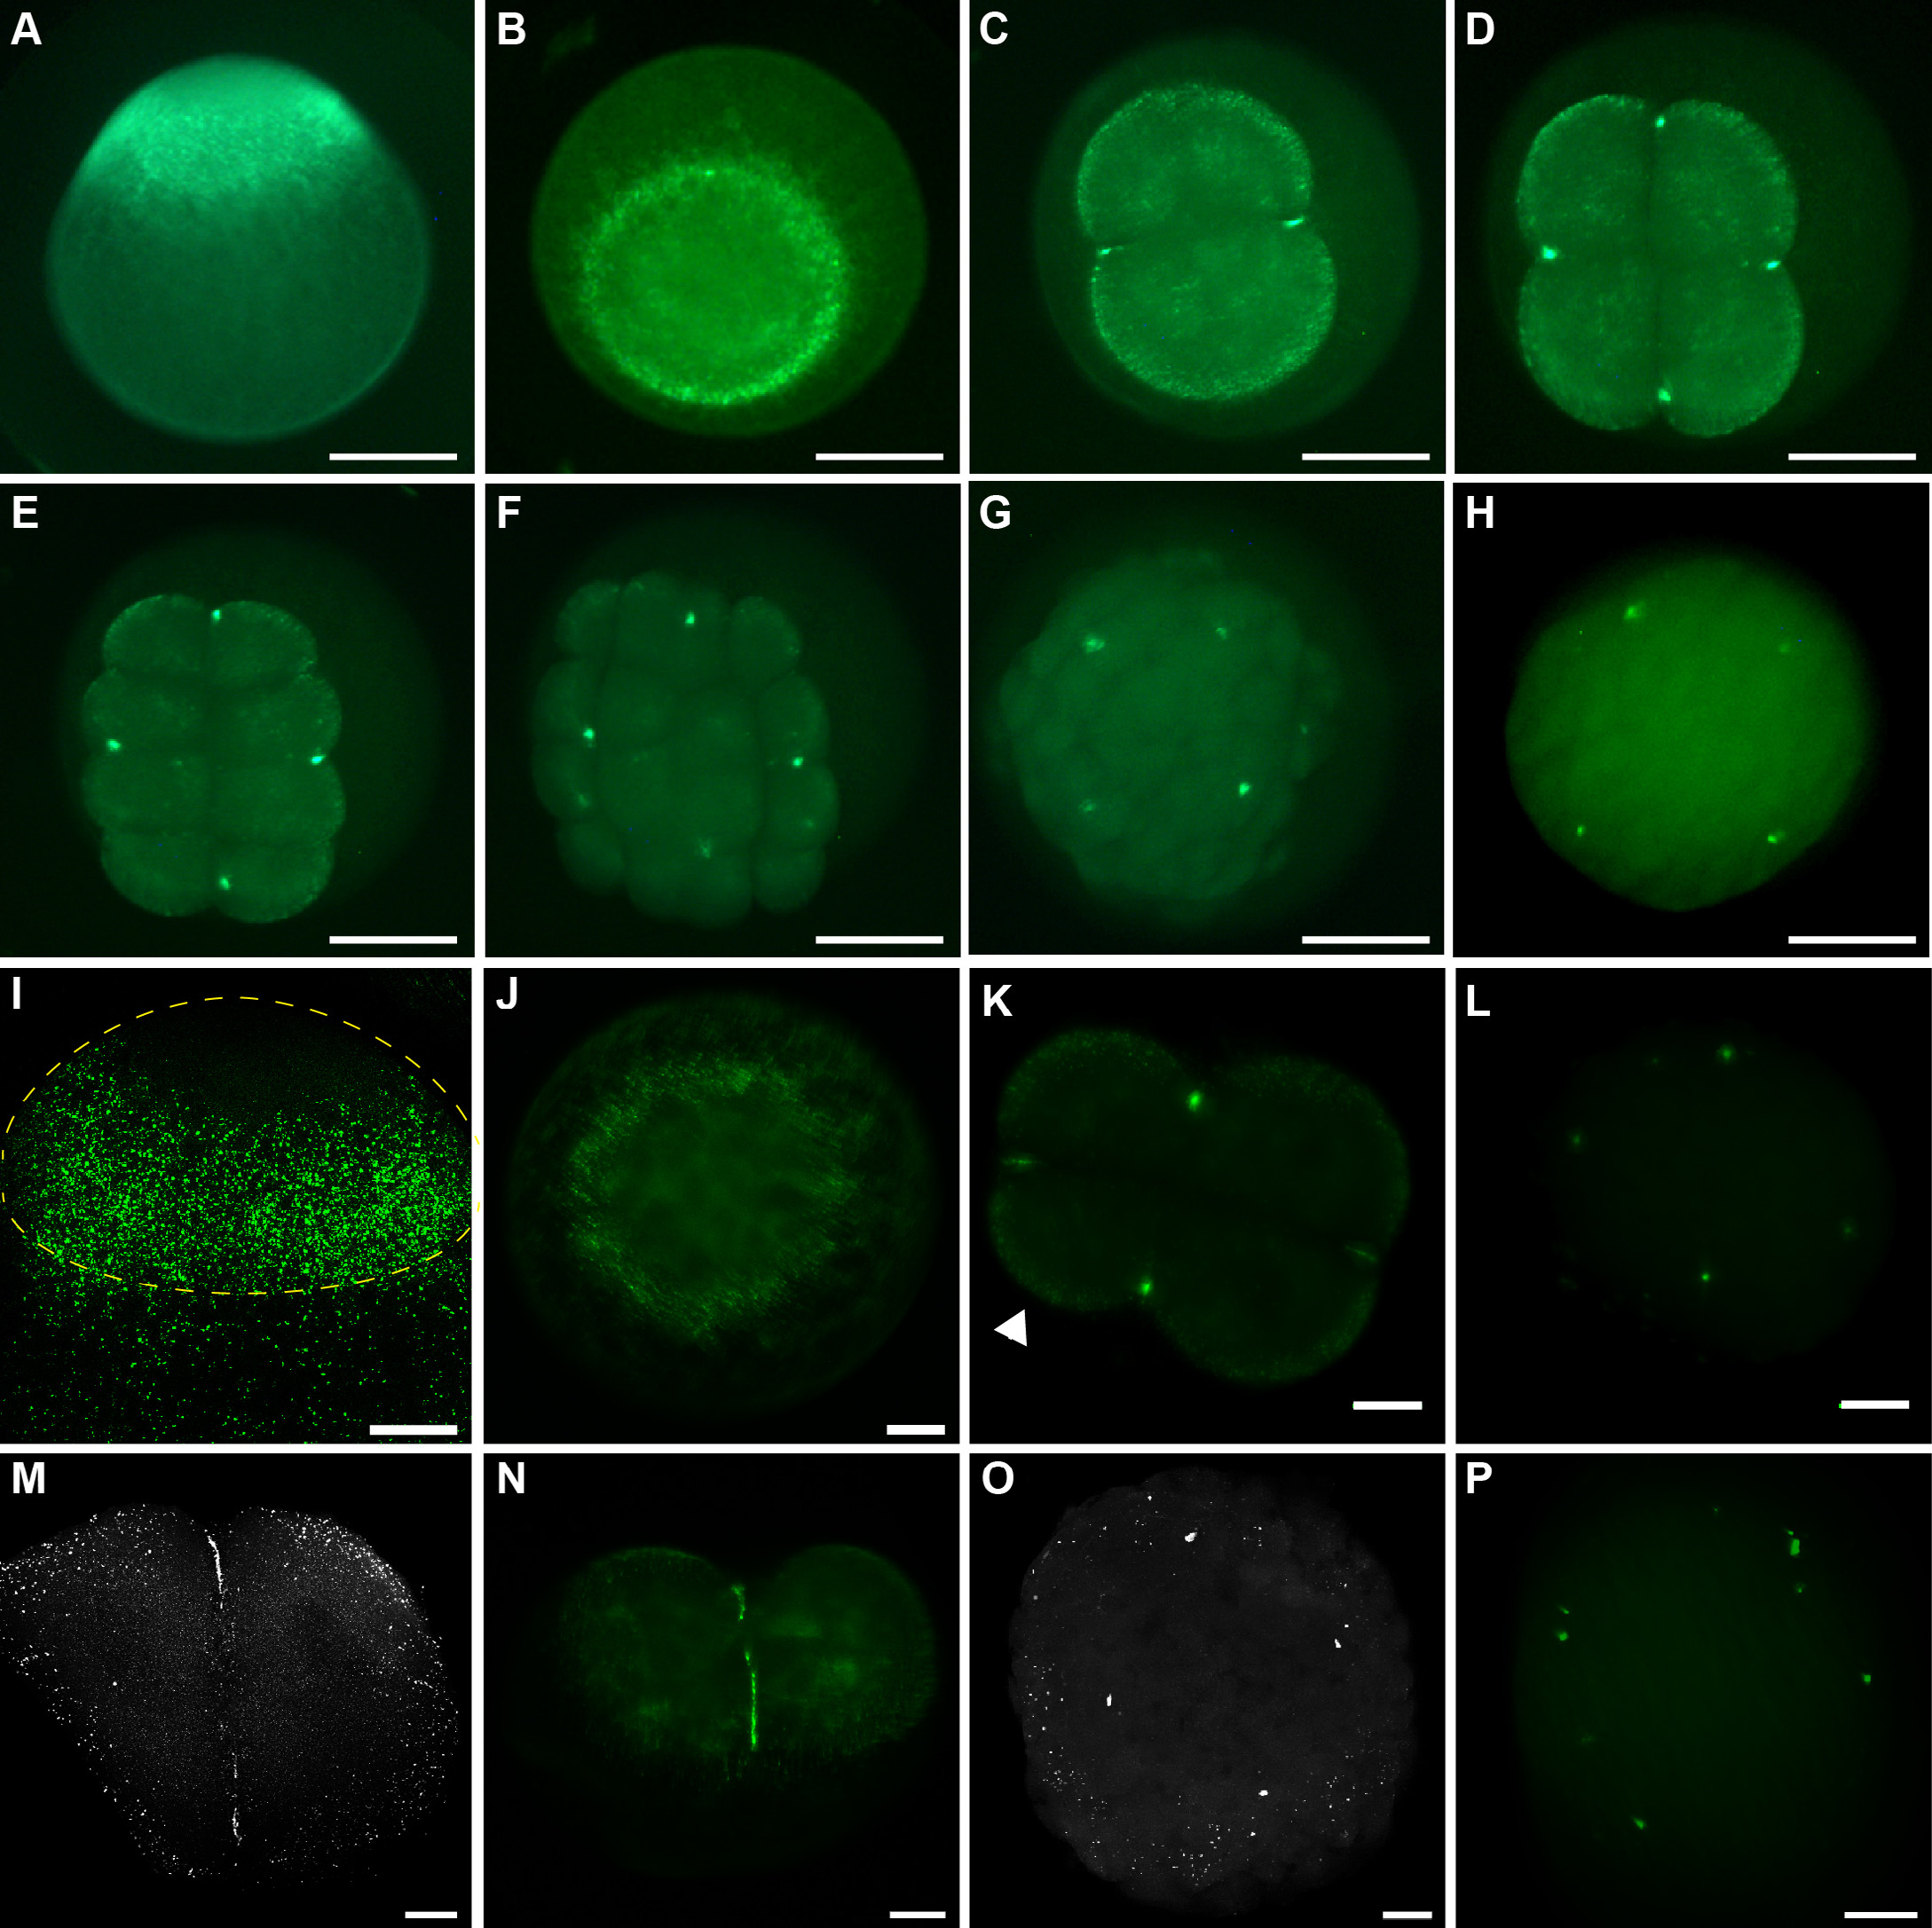
Fig. 4
Buc-GFP localization during embryogenesis. (A–H) Images of living embryos from Buc-GFP mothers at 1- (A, B), 2- (C), 4- (D), 8- (E), 16- (F), 128-cell (G), and high stage (H). (I–L) Confocal images of living embryos from transgenic mothers at the 1- (I, J), 4-(K), and 256-cell-stage (L). (I) Dashed yellow line outlines the blastomere in the zygote. Note that the animal region was free of fluorescent signal. (J) Fluorescent granules formed a ring at the preaggregation stage. (K, L) The four blastomeres accumulated fluorescent granules at their cortex (arrowhead), which disappeared by the 256-cell stage. (M–P) Confocal images comparing endogenous Buc (white) in wild-type (M, O) with GFP (green) in Buc-GFP embryos (N, P) at the 2-cell (M, N) or high-stage stage (O, P). (A, I) Lateral views, (B–H, J–P) animal views. Scale bar: 50 µm (N, P), 100 µm (I–M, O), 200 µm (A–H).
Reprinted from Gene expression patterns : GEP, 18(1-2), Riemer, S., Bontems, F., Krishnakumar, P., Gömann, J., Dosch, R., A functional Bucky ball-GFP transgene visualizes germ plasm in living zebrafish, 44-52, Copyright (2015) with permission from Elsevier. Full text @ Gene Expr. Patterns