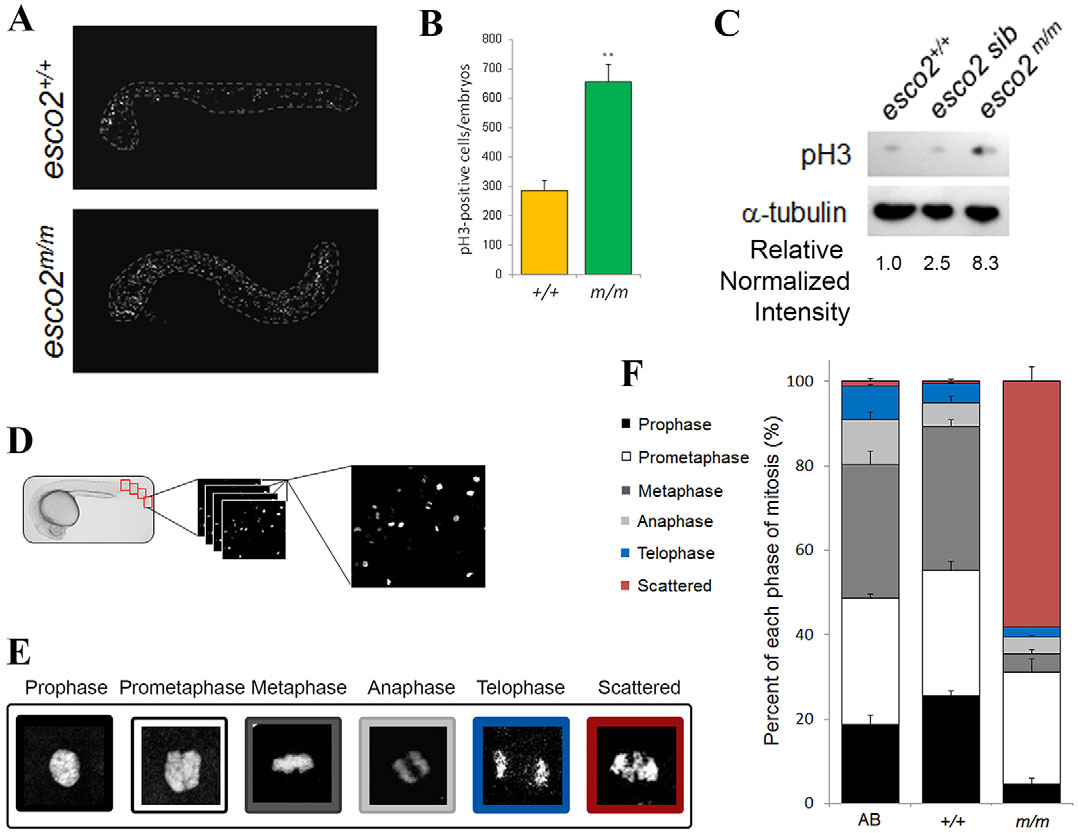
Fig. 3
esco2 deficiency results in an elevated mitotic index and scattered chromosomes. (A) Maximum intensity projections of whole-embryo confocal z-stack images of pH3-stained fixed WT and mutant embryos. The embryo proper is outlined by the white dotted line. Yolk has been removed for imaging. (B) Quantification of the number of pH3-positive cells per embryo in A (n=3/genotype, mean±s.d., **P<0.01). (C) Western blot analysis for pH3 protein levels from esco2+/+ (AB), esco2 sibling (+/+ and m/+) and esco2 mutant (m/m) embryo protein lysates. Relative intensity calculated using ImageJ; each sample was normalized to α-tubulin intensity, and then relative expression was calculated against esco2+/+ (relative normalized intensity=1). (D) Diagram of mitotic profiling. Four independent fields of a pH3-labeled embryo are imaged, compiled using maximum intensity projection, and scored for each phase of mitosis based on chromosome morphology. (E) Colored panels depict the associated pH3 morphology to its phase in mitosis. (F) Graph depicting the percentage of cells in each phase of mitosis between AB (the WT parental strain) controls, esco2+/+ and esco2m/m embryos (four fields/embryo, ne70 morphologies per embryo, three embryos/genotype, mean±s.d.); the P-value of scattered between esco2+/+ and esco2m/m is 0.0062.

