
|
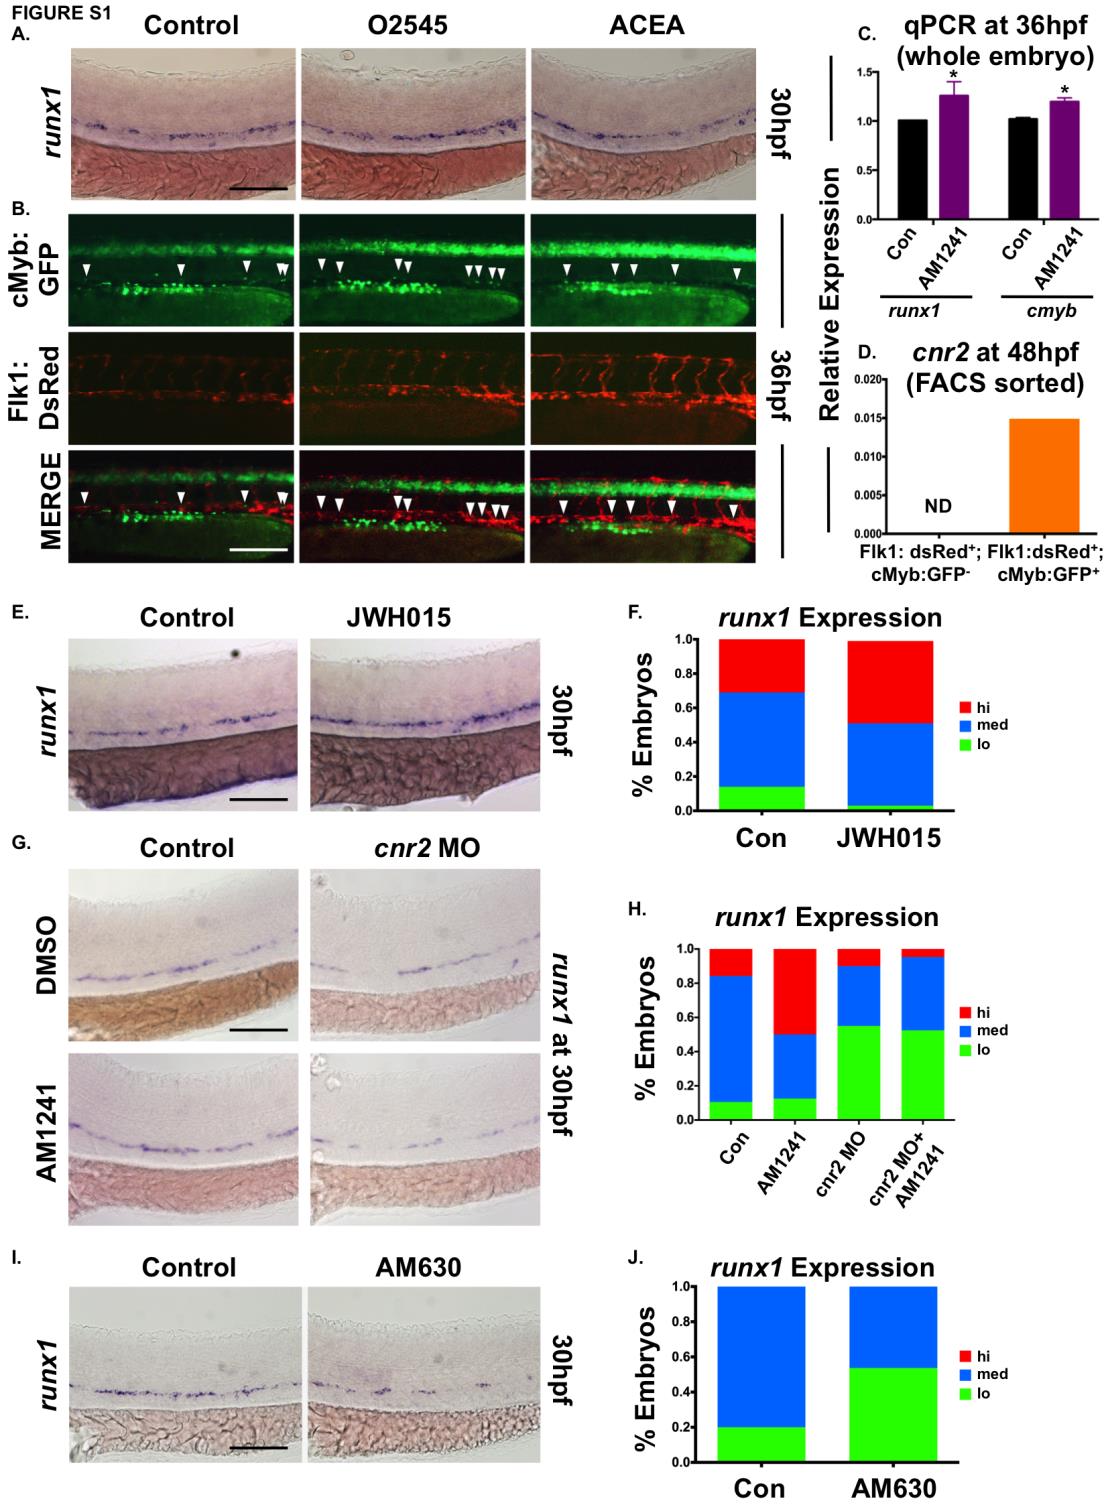
Fig. S1 CNR2-selective signaling modulates HSC number in the AGM.
(A) Exposure of WT embryos to a synthetic dual CNR1-/CNR2-selective agonist (O2545) or CNR1- selective agonist (ACEA) during HSC formation (12-30hpf) indicated that only CNR2-stimulation impacted runx1 expression in the AGM (n>85/condition; see also Figure 1B).
(B) In vivo imaging of flk1:dsRed;cmyb:egfp embryos showed the number of Flk1:dsRed+;cMyb:GFP+ HSCs (arrowheads) was increased in the AGM at 36hpf following exposure to O2545 but not ACEA (CNR1-selective) (ne7/condition; see also Figure 1D).
(C) qPCR quantification of the increase in runx1 and cmyb expression at 36hpf in embryos exposed to AM1241 during HSC formation (12-36hpf) (runx1: 1.25-fold, cmyb: 1.20-fold, *p≤0.05, 1-tailed ttest, n=25 pooled embryos/condition x 4 replicates).
(D) qPCR analysis of FACS-sorted populations from flk1:dsRed;cmyb:egfp embryos at 48hpf revealed cnr2 was expressed on HSCs (Flk1:dsRed+ ;cMyb:GFP+) but not on endothelium (Flk1:dsRed+;cMyb:GFP-) (HSC: 0.015 a.u.; endothelium: not detected (ND), normalized to 18s).
(E) Exposure to JWH015 (CNR2-selective agonist) during HSC formation (12-30hpf) increased runx1 expression in the AGM (n≥130/condition) at 30hpf.
(F) Qualitative phenotypic distribution of embryos from panel S1E, scored with low, medium or high runx1 expression in the AGM.
(G) AM1241-exposure failed to increase runx1 expression in the AGM of cnr2 morphants, confirming phenotypic receptor specificity (n≥15/condition) at 30hpf.
(H) Qualitative phenotypic distribution of embryos from panel S1G, scored with low, medium or high runx1 expression in the AGM.
(I) Exposure to the CNR2 antagonist AM630 during HSC formation (12-30hpf) reduced runx1 expression in the AGM (n≥50/condition) at 30hpf.
(J) Qualitative phenotypic distribution of embryos from panel S1I, scored with low, medium or high runx1 expression in the AGM.
Scale bars: A,B,E,G,I=100µm.