
|
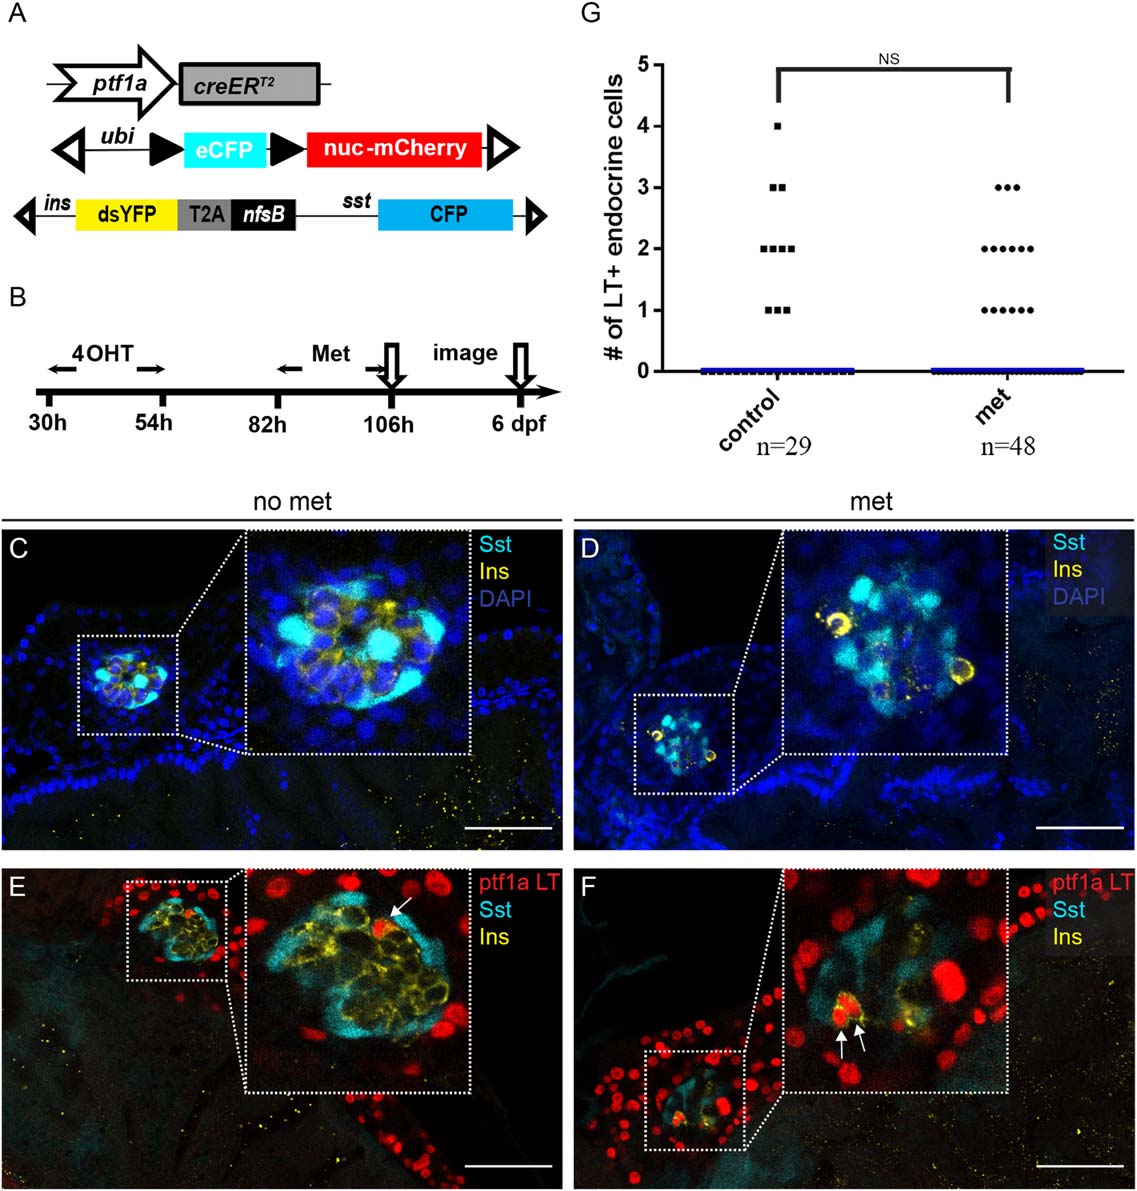
Fig. 4
The ptf1a lineage contributes to β-cell regeneration. A: Schematic depicting the triple transgenic line utilized in the experiment. B: Experimental setup. C, D, E, F: Inserts show zoomed-in views of the principal islet region. C: In control fish with no Metronidazole (Met) treatment, the principal islet has compact architecture. Insulin (Ins), yellow. Somatostatin (Sst), cyan. Nuclei are labeled by DAPI (blue). D: Pancreatic region following 24 hr of Met treatment. The majority of Insulin-secreting cells are gone. Insulin (Ins), yellow. Somatostatin (Sst), cyan. DAPI, blue. E, F: The ptf1a lineage is labeled by nuclear-mCherry expression (red) 48 hr after removal of Met. E: In untreated fish, there are rare ptf1a lineage cells traced into the principal islet. Insulin (Ins), yellow. Somatostatin (Sst), cyan. F: In the-Met treated fish, two regenerated β cells express the ptf1a lineage label. Insulin (Ins), yellow. Somatostatin (Sst), cyan. In E and F, arrows point to Insulin+ cells that are labeled with the ptf1a lineage mark. G: Scatter plot shows quantification of ptf1a lineage–labeled cells within the endocrine compartment. No significant differences in the frequency of ptf1a lineage contributions are observed between normal and regenerating β cells. “n” indicates the number of fish quantified for each condition. Blue bars show population medium.