Fig. 3
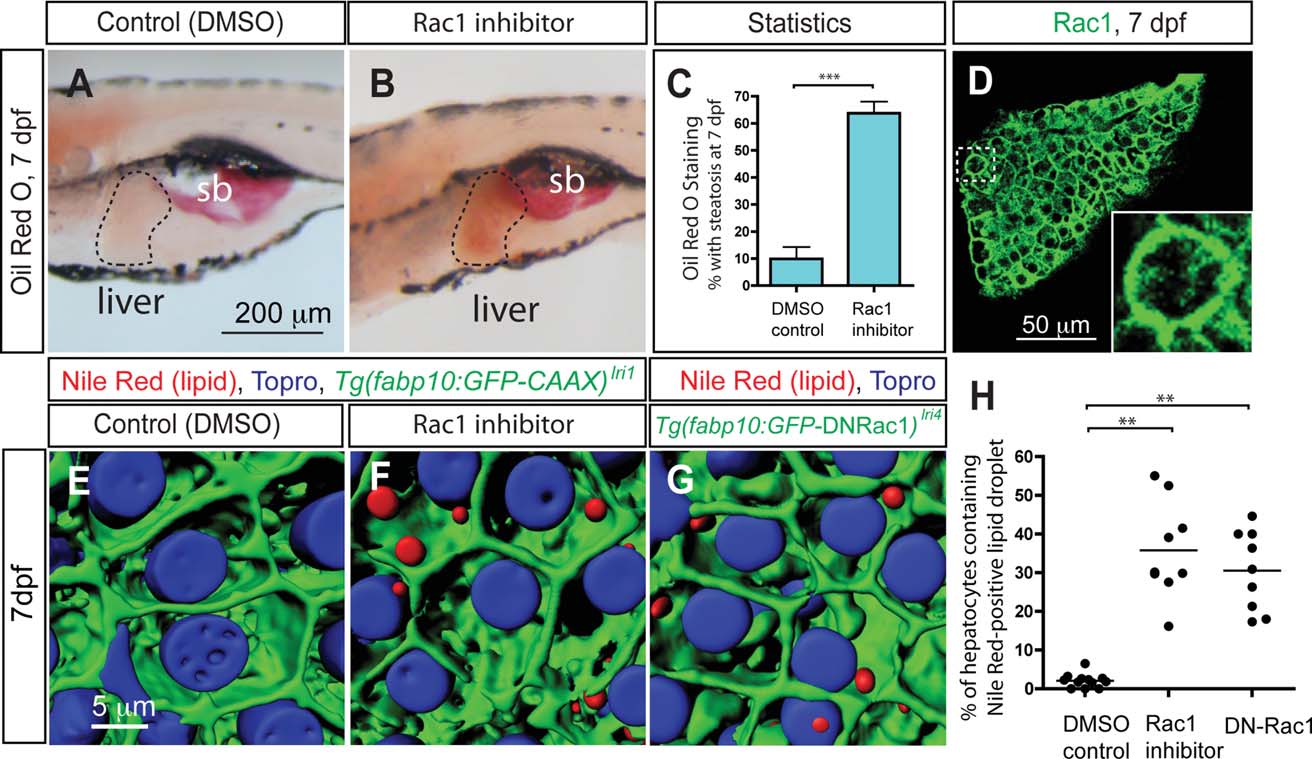
The small GTPase Rac1 regulates hepatic steatosis. (A,B) Lateral views of wild-type larvae treated with DMSO (A) or Rac1 inhibitor (B) from 5 to 7 dpf and stained for ORO at 7 dpf. Rac1 inhibitor-treated larvae developed hepatic steatosis. (C) The percentage of DMSO or Rac1 inhibitor-treated larvae showing liver steatosis scored by whole-mount ORO staining. ORO staining experiments with Rac1 inhibitor-treated larvae were repeated 12 times with an average n = 12.1 larvae per experiment (total n = 146 larvae examined and total n = 89 larvae showed ORO signal in the liver). (D) Z-plane confocal image of the dissected liver of wild-type larvae visualized for Rac1 expression at 7 dpf. Rac1 is localized to the entire cell membrane of most cells in the liver. The outlined area is magnified and shown in the bottom right corner. (E,F) Projected confocal images of lipid droplets in the liver stained by Nile Red. Tg (fabp10:GFP-CAAX)lri1 larvae treated with DMSO (E) or Rac1 inhibitor (F) visualized for GFP expression and Nile Red (red) and To-pro-3 (blue) staining at 7 dpf. (G) Projected confocal image of Tg (fabp10:GFP-DNRac1)lri4 liver visualized for GFP expression and Nile Red (red) and To-pro-3 (blue) staining at 7 dpf. (H) Quantification of liver steatosis measured by the percentage of hepatocytes containing Nile Red positive lipid droplets in DMSO-treated control, Rac1 inhibitor-treated, and Tg (fabp10:GFP-DNRac1)lri4 larvae at 7 dpf. *P < 0.05, **P < 0.01, ***P < 0.001; error bars indicate SD.

