
|
Fig. 5
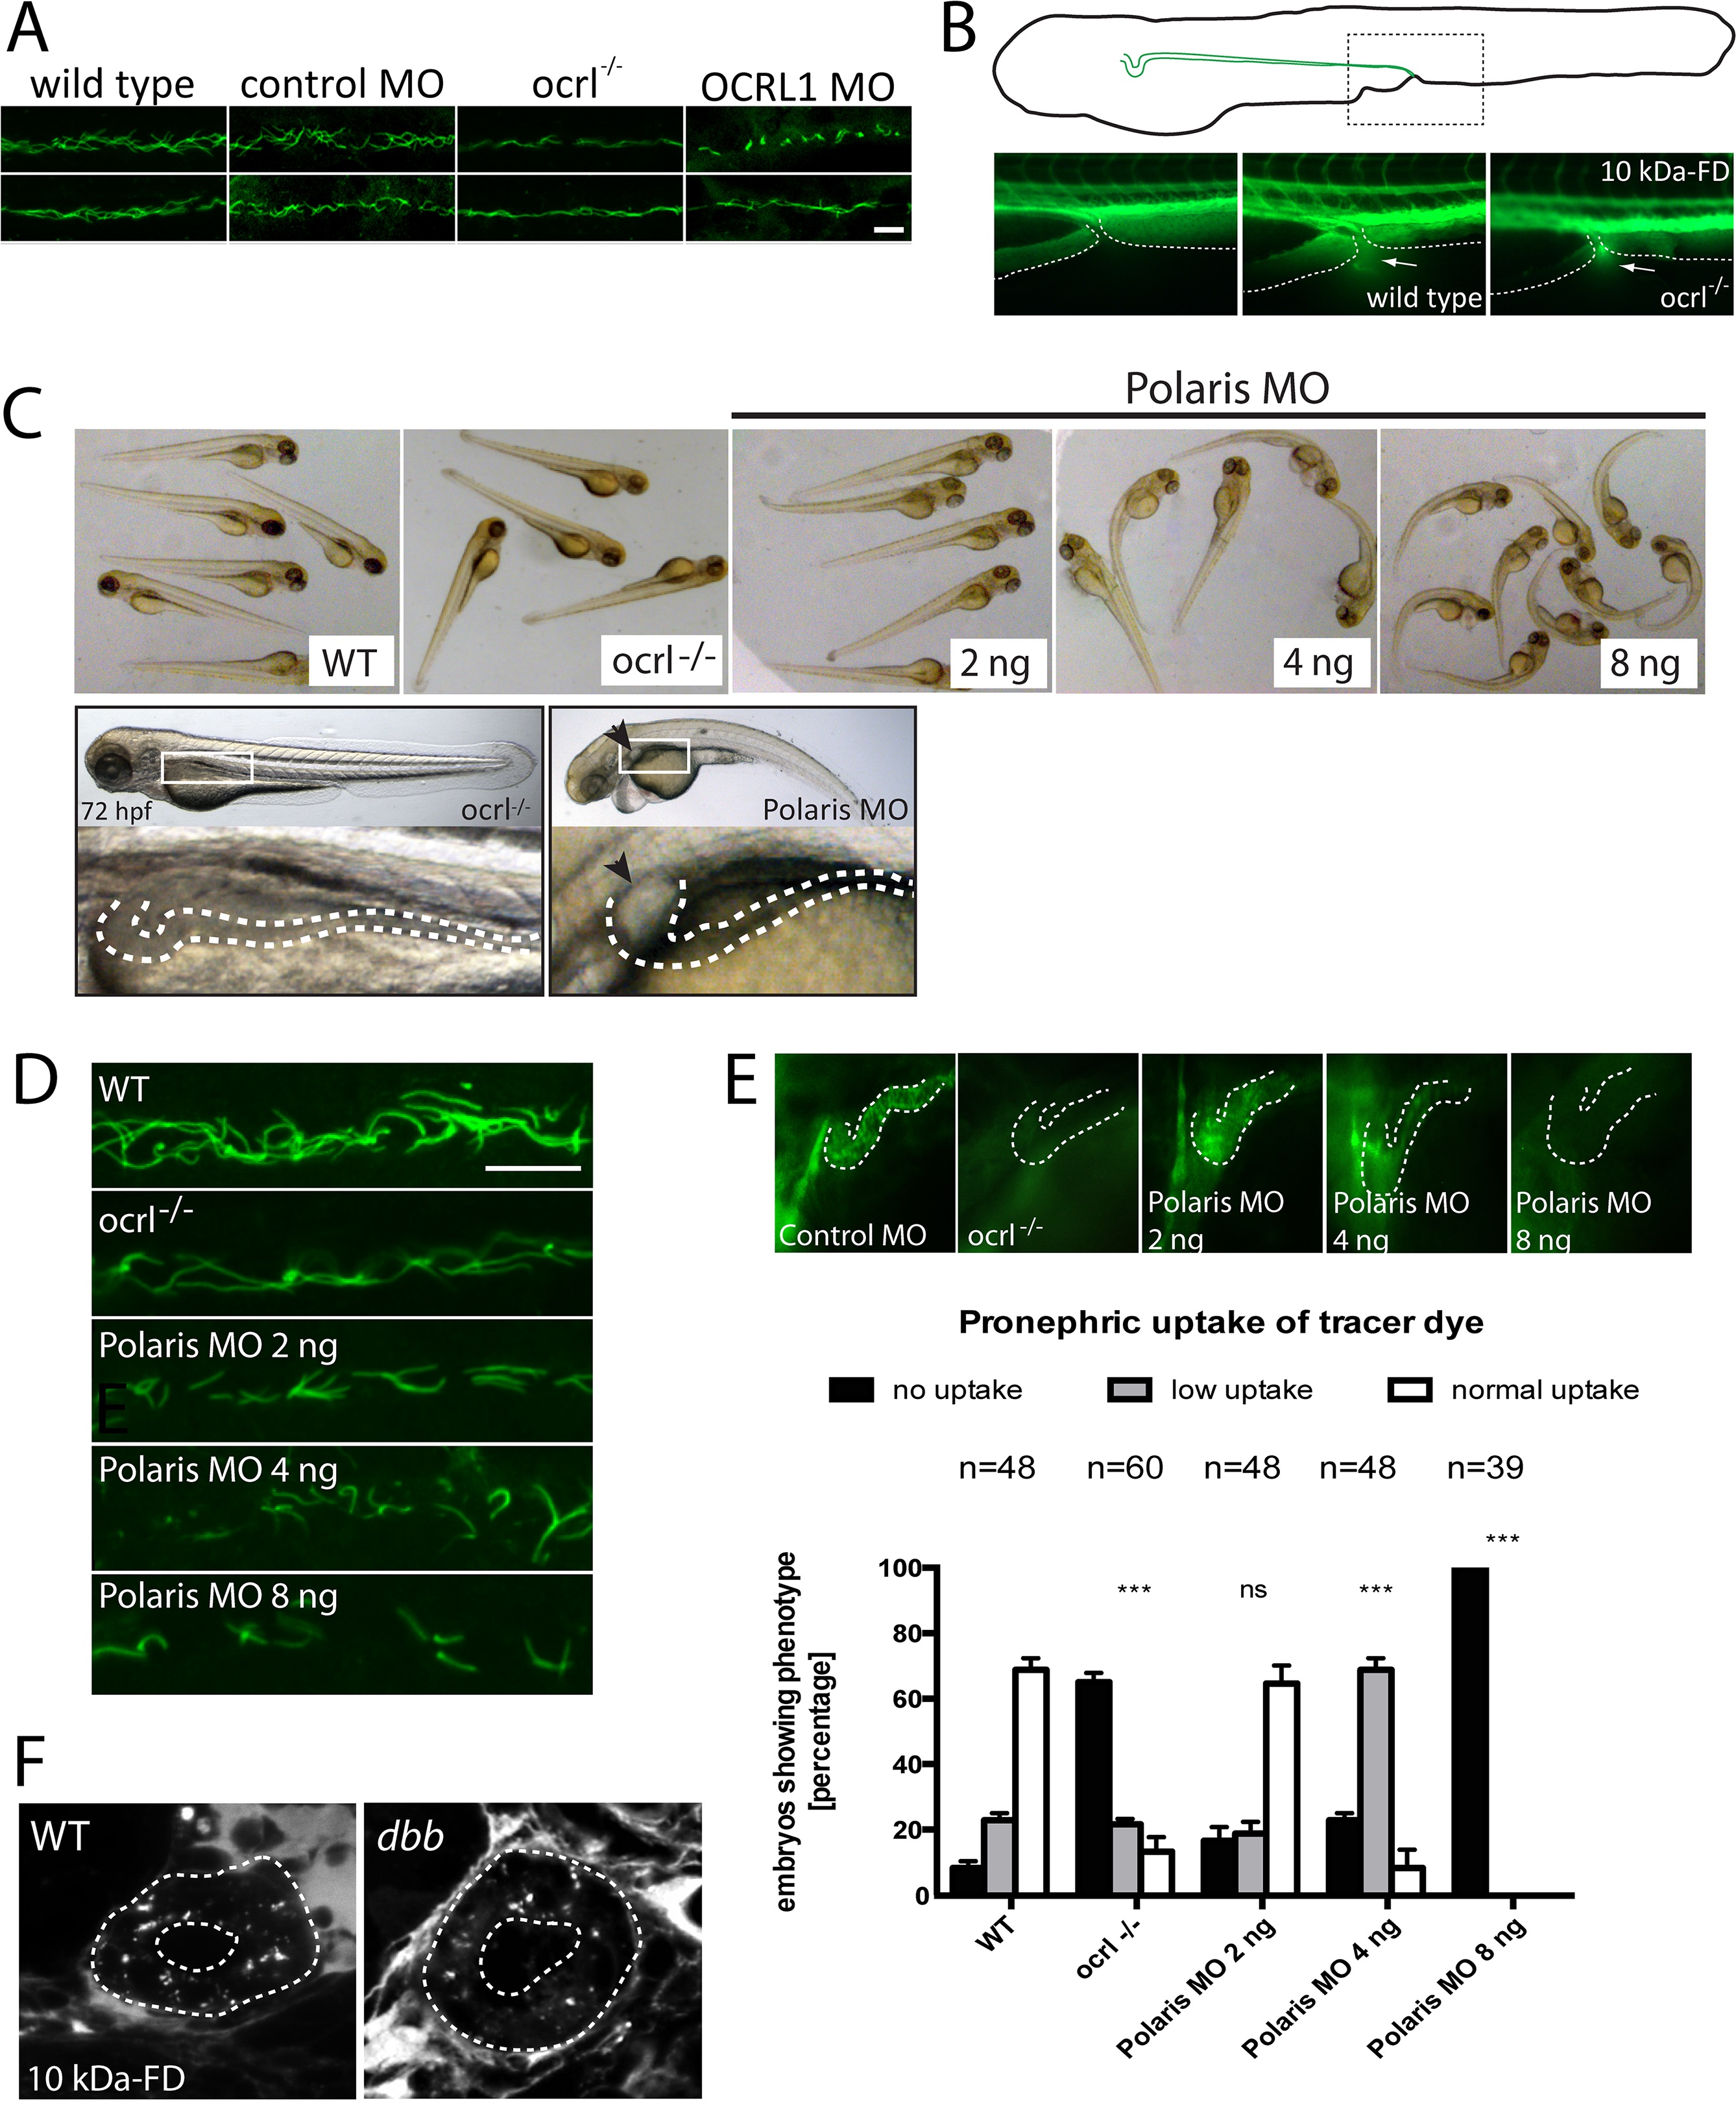
Pronephric cilia in ocrl-/- zebrafish.
A. Confocal images of pronephric cilia, detected using anti-acetylated tubulin antibody, in wild-type, ocrl-/- mutant, control morphant or OCRL1 morphant zebrafish embryos (26hpf). B. Fluorescence dissecting microscope image of excretion of Alexa 488-10 kDa dextran from the cloacae of zebrafish embryos (72hpf). Bottom panels show cloacae immediately after injection (left) and excreting dextran 30–60s after injection (wild-type middle, ocrl-/- right). Dextran excretion was identical in control and ocrl-/- embryos (20 embryos of each genotype, 2 independent experiments). C. Brightfield images of wild-type (WT), ocrl-/- mutant or IFT88/polaris morphant (MO) embryos. The morphants were injected with different concentrations of morpholino as indicated. Embryos were imaged using brightfield microscopy. Bottom panel shows ocrl-/- mutant and polaris morphant (injected with 4 ng MO) and zoom of boxed area. The arrowhead indicates a pronephric cyst in the polaris morphant. D. Confocal images of pronephric cilia, detected using anti-acetylated tubulin antibody, in wild-type (WT), ocrl-/- mutant or IFT88/polaris morphant (MO) embryos. E. Wild-type (WT), ocrl-/- mutant and IFT88/polaris morphant embryos were injected with Alexa 488-10 kDa dextran (green) and pronephric accumulation after 2.5 h monitored by fluorescence microscopy. The pronephric tubules are indicated with a dashed line. Uptake was quantitated as indicated. Data are presented as the mean ± SEM. Statistical analysis was performed using the Pearson’s chi-squared test. ***p < 0.0001, **p < 0.001, *p < 0.01. F. Confocal transverse sections of the zebrafish proximal pronephric tubule of 72 hpf wild type and double bubble (dbb) cilia mutant showing 10 kDa-FD uptake into endocytic compartments in pronephric cells 2h after injection. Scale bars represent 10 µm (A and D).