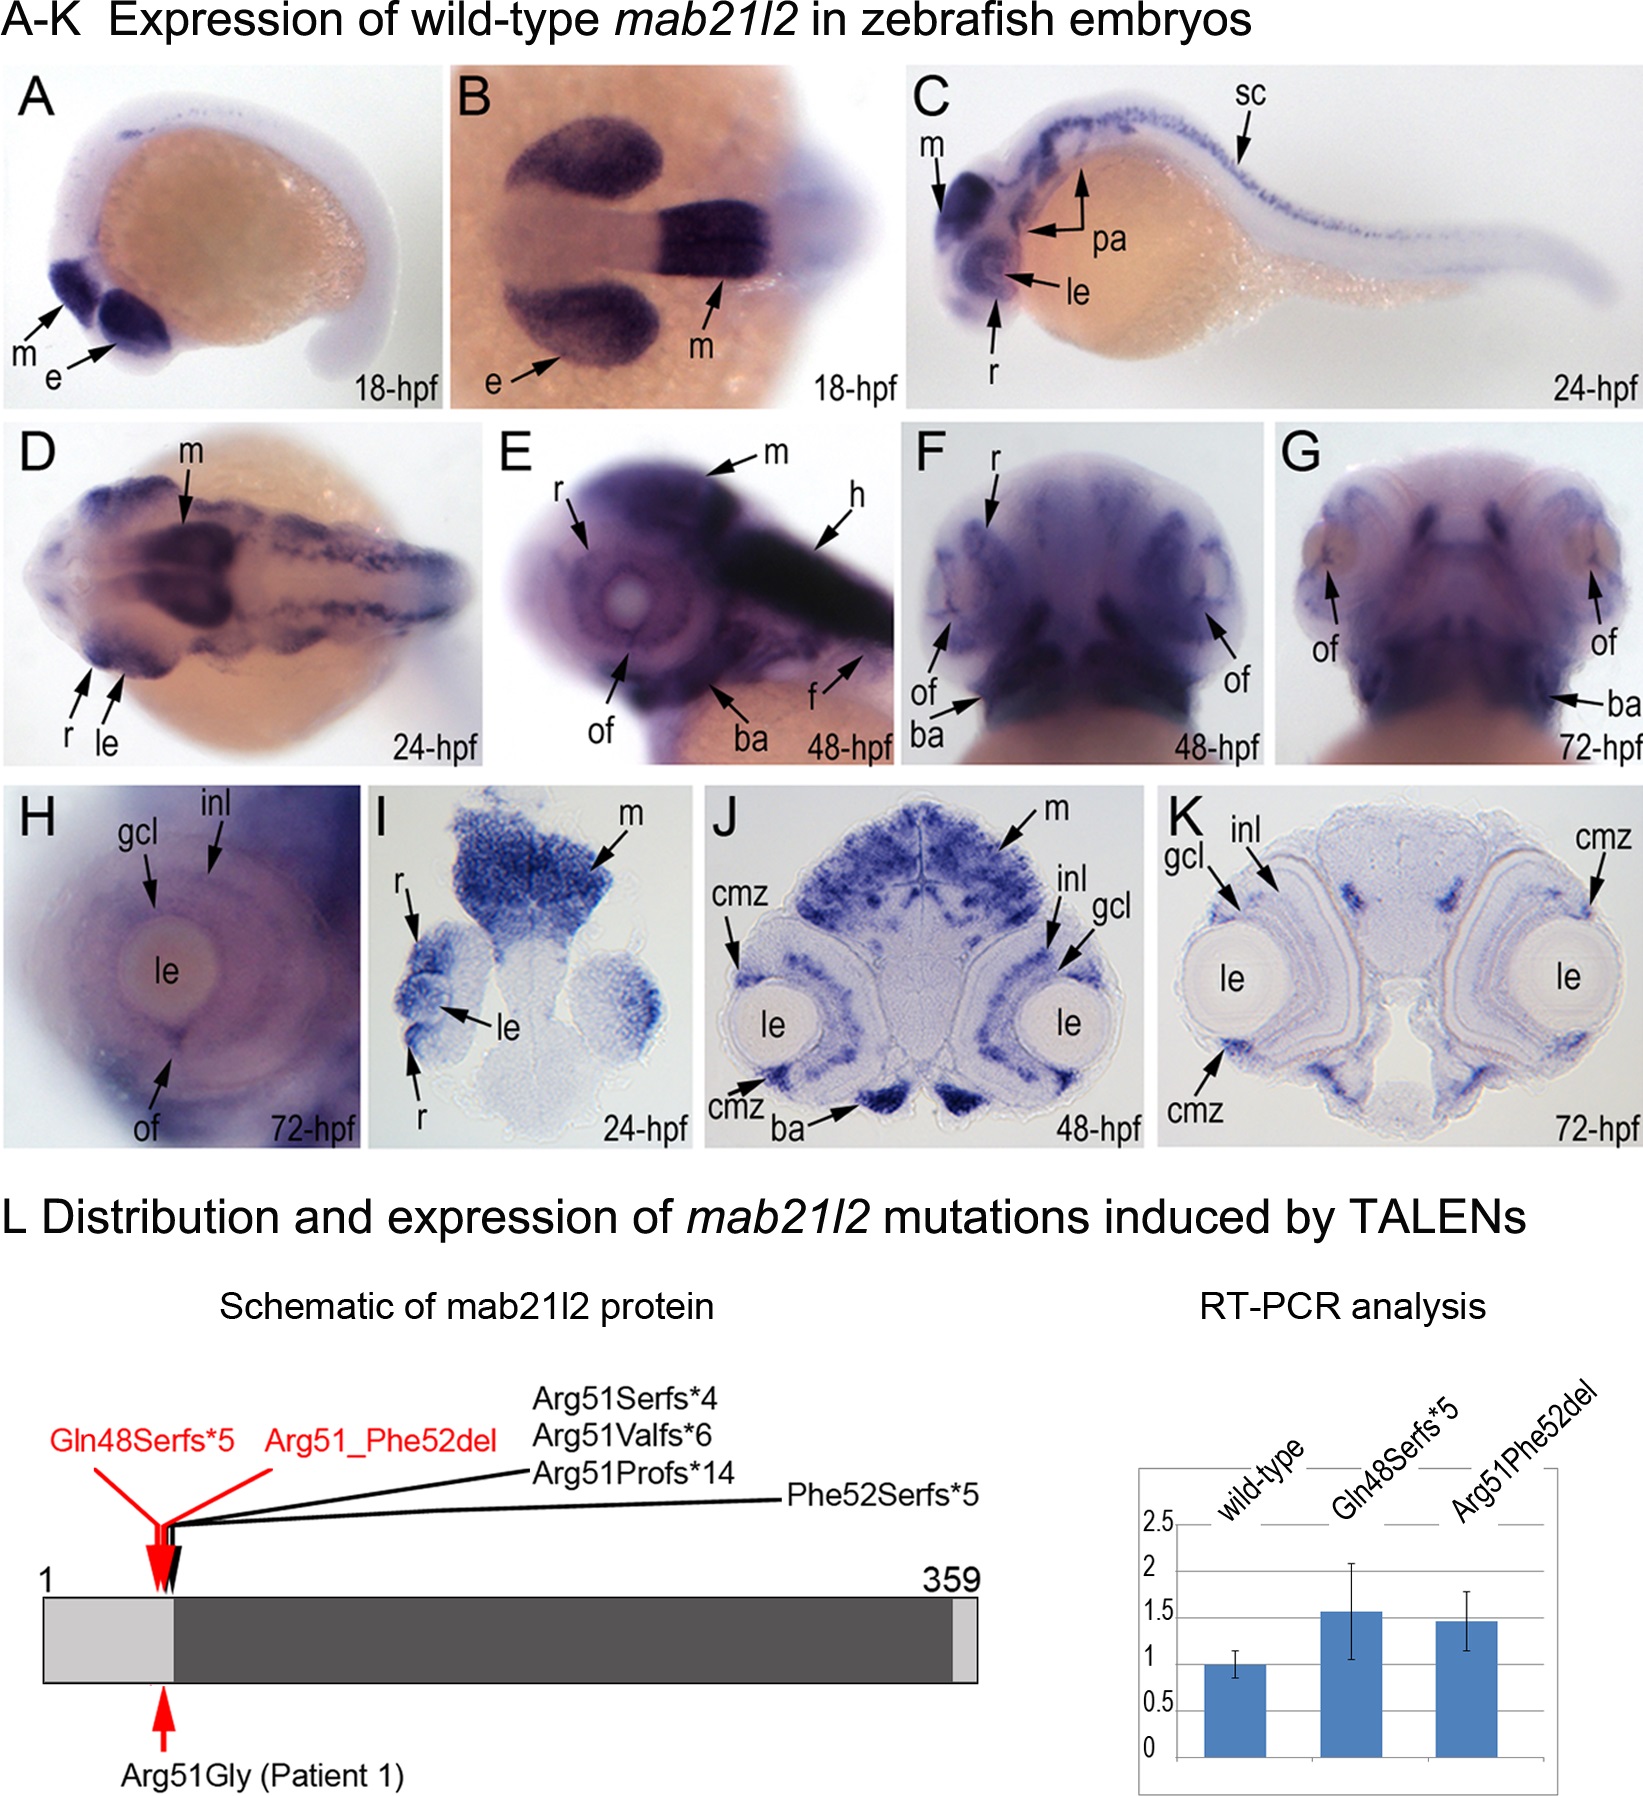
Fig. 3
Expression and mutations of zebrafish mab21l2.
A-K. Expression pattern of mab21l2 in zebrafish 18–72-hpf embryos. Whole mount images (A-H) and sections (I-K) are shown. A, B. At 18-hpf, expression in the presumptive eye field (e) and midbrain (m) is observed. C, D, I. At 24-hpf, mab21l2 expression is seen in the periphery of the retina (r), lens (le), spinal cord (sc), midbrain (m) and pharyngeal arch region (pa). E-H, J, K. At 48–72-hpf, expression in the ciliary marginal zone (cmz), inner nuclear layer (inl) and ganglion cell layer (gcl) of the retina, and the region of the optic fissure (of) in the eye as well as the midbrain (m), hindbrain (h), developing fins (f), and branchial arches (ba) is shown with arrows. L. Distribution and expression of mab21l2 mutations induced by TALENs. On the left, a schematic of the zebrafish mab21l2 protein is shown as a light grey box with the mab-21 domain (amino acids 62–346) indicated in dark grey color; the positions of the zebrafish mutations identified in the progeny of TALEN-injected fish are shown at the top of the box and the position of the human mutation identified in Patient 1 is indicated at the bottom; the positions of the p.(Gln48Serfs*5) and p.(Arg51_Phe52del) mutations are shown with red arrows. On the right, a graph summarizing results of semi-quantitative RT-PCR analysis of wild-type and mutant mab21l2 transcript levels in 48-hpf homozygous embryos is shown.

