Fig. 2
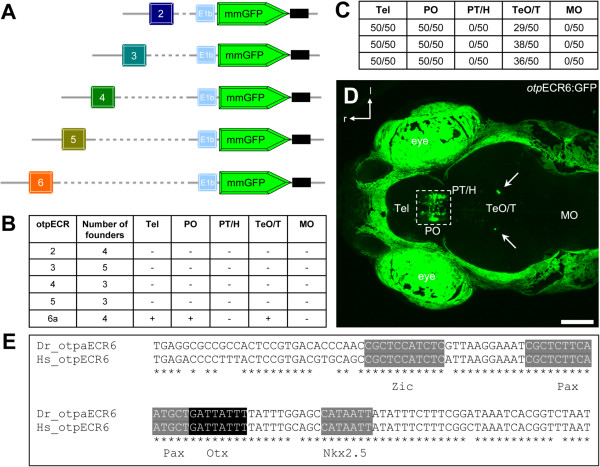
Enhancer activity displayed by stableotpECR-transgenic lines. A, A schematic depiction of constructs used to generate the transgenic lines. B, Enhancer activity displayed by transgenic lines analyzed at 3-5 dpf. The table shows the GFP levels and expression patterns observed in cardiac-RFP positive founders for the individual otpECRs. C, Numbers of larvae showing GFP+ cells within different brain regions (Data from 3 independent clutches are shown, n = 50 per clutch). In all animals, the caudal telecephalic-preoptic cluster is present, and in many animals, few ectopic cells appear in the tectal-tegmental region. D, Confocal z-stack maximum projection of a dorsal in vivo view of Tg(otpECR6-E1b:mmGFP) expression. GFP is expressed in a dense cluster within the preoptic area and extends into the caudal telencephalon. In many larvae, a few isolated ectopic cells can be detected in the midbrain. E, The evolutionarily conserved region otpECR6 contains predicted binding sites for transcription factors belonging to the families Otx, Pax, Nkx and Zic. The otpECR6 DNA sequences of zebrafish (Dr) and human (Hs) were aligned and analyzed using the multiF program (https://multitf.dcode.org webcite of the ECR browser). Abbreviations: Tel, telencephalon; PO, preoptic area; PT, posterior tuberculum; H, hypothalamus; TeO, optic tectum; T, tegmentum; MO, medulla oblongata; r, rostral; l, lateral. Scale bar: 100 µm.

