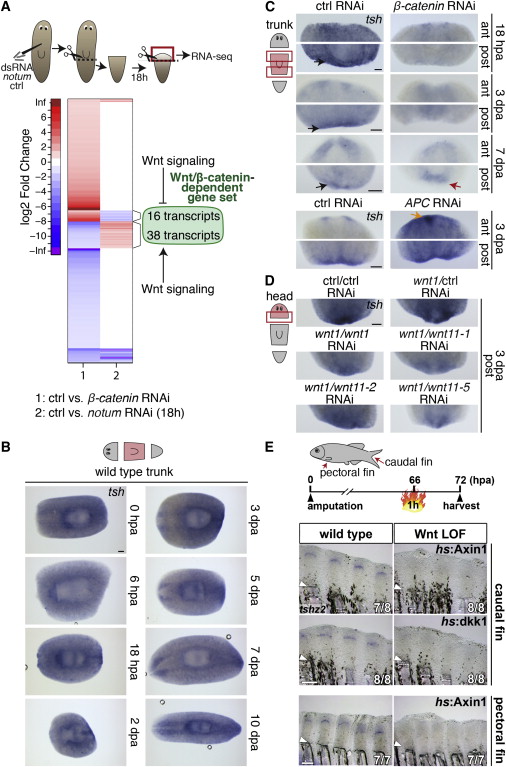
Fig. 3
tsh Genes Are Induced in Regenerating Tissues of Planarians and Zebrafish in a Wnt/β-Catenin-Dependent Manner
(A) Experimental set-up for the identification of differentially expressed (DE) genes after notum RNAi, 18 hr postamputation (hpa). Heatmap of DE genes (n = 367) after β-catenin and notum RNAi according to their log2 fold change (control versus notum or β-catenin RNAi) (adjusted p value <0.05). Upregulation is indicated in red; downregulation is in blue. Note that 16 upregulated and 38 downregulated transcripts after β-catenin RNAi are inversely regulated after notum RNAi.
(B) WISH time course of tsh expression during regeneration of planarian trunk fragments.
(C) tsh expression at anterior and posterior regeneration sites of ctrl (control) trunk fragments and after β-catenin or APC RNAi at indicated regeneration time points. Black arrow; posterior tsh expression; red arrow: ectopic posterior brain; orange arrow: ectopic anterior tsh expression.
(D) Posterior tsh expression in control RNAi head fragments 3 dpa is reduced after wnt1 RNAi. Note that simultaneous knockdown of wnt11-1/-2 and -5 enhances the effect of wnt1 RNAi on tsh expression.
(E) Zebrafish tshz2 is robustly expressed in caudal and pectoral fin regenerates at 72 hpa, and its expression is strongly reduced upon overexpression of the Wnt/β-catenin antagonists axin1 or dkk1 for 6 hr in hs:Axin1 or hs:dkk1 transgenic fin regenerates. Arrowhead: amputation plane. Numbers indicate the number of fins showing the depicted expression pattern and the total number of fins analyzed.
Scale bar, 100 µm in (B)–(D), 200 µm in (E). See also Figure S3, Data S3, and Table 1.

