Fig. 5
Normal Hindbrain Development in megamind Mutant Embryos
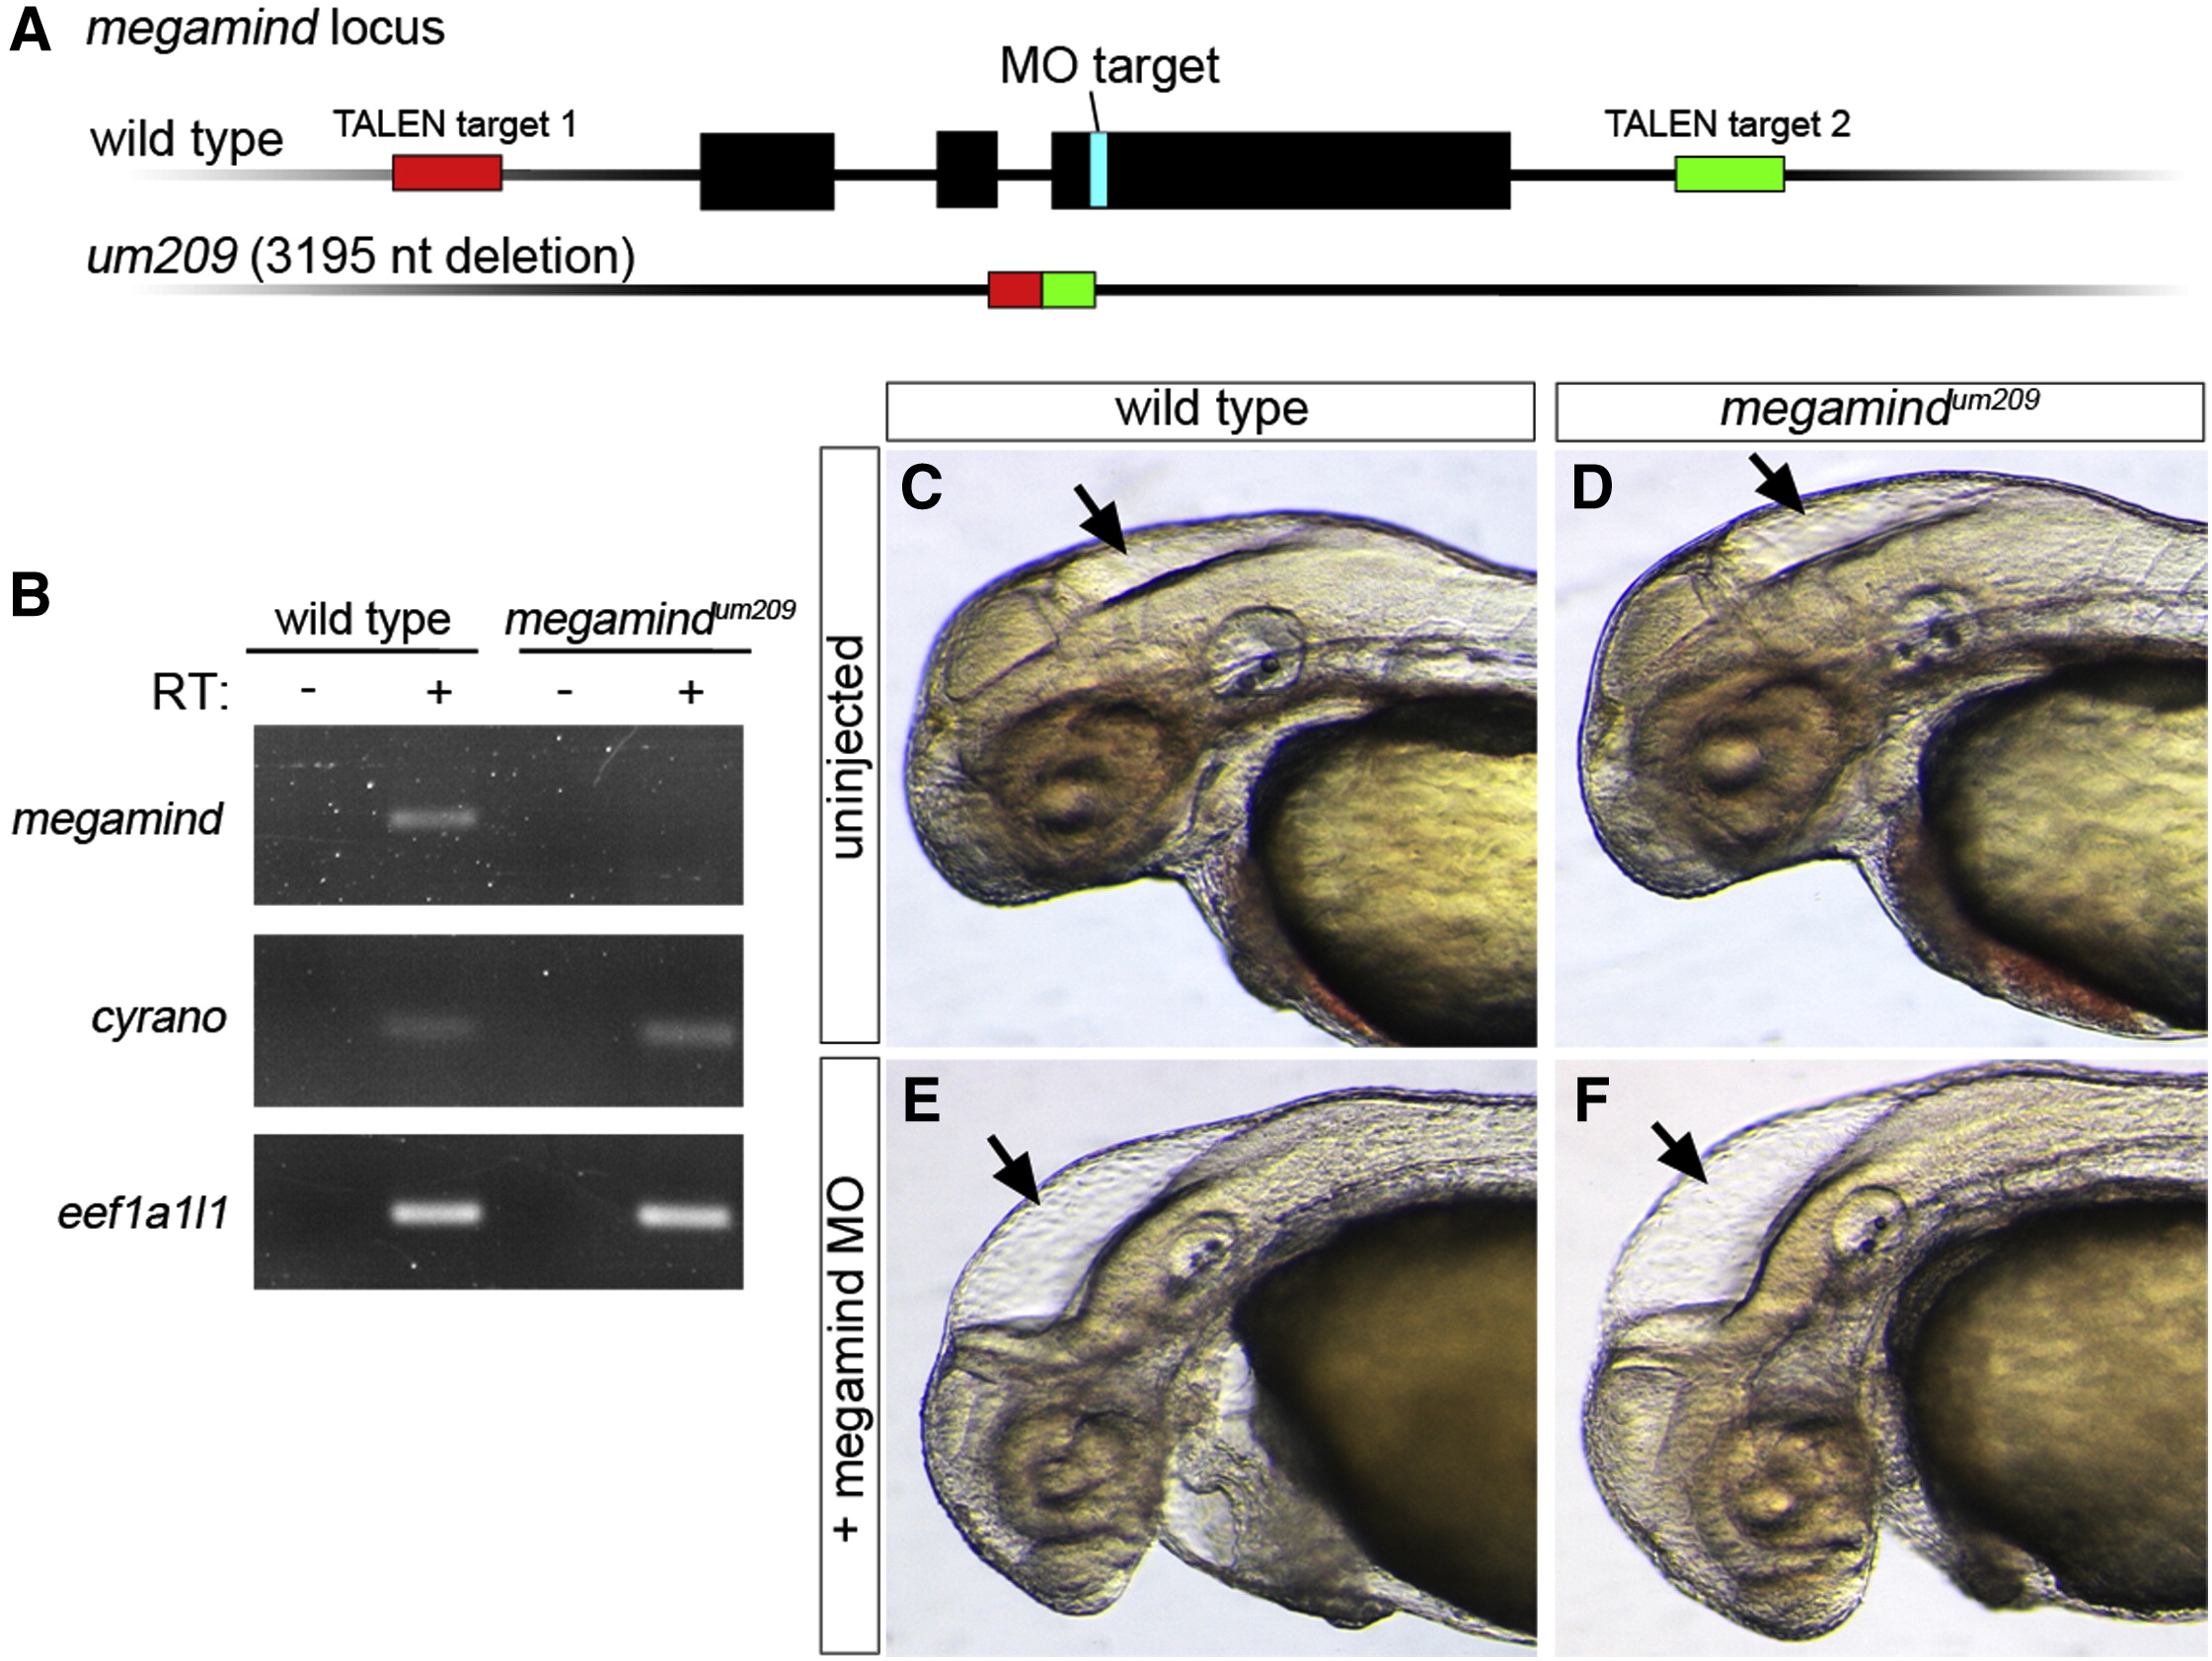
(A) Schematic of the megamind locus in wild-type and megamindum209 mutants. The red and green boxes indicate relative position of the TALEN target sequences, and the MO target sequence is shown.
(B) RT-PCR for the megamind and cyrano lincRNAs as well as eef1al1 in wild-type and megamindum209 mutant embryos. RT refers to RNA template without () or with (+) reverse transcription.
(C–F) Transmitted light images of the head region in embryos at 48 hrpf. The hindbrain ventricle is indicated with an arrow in each image. Lateral views, anterior to the left, and dorsal is up. (C) Wild-type, uninjected; (D) megamindum209 mutant; (E) wild-type injected with 20 ng megamind conserved site MO; and (F) megamindum209 mutant injected with megamind conserved site MO.
Reprinted from Developmental Cell, 32(1), Kok, F.O., Shin, M., Ni, C., Gupta, A., Grosse, A.S., van Impel, A., Kirchmaier, B.C., Peterson-Maduro, J., Kourkoulis, G., Male, I., DeSantis, D.F., Sheppard-Tindell, S., Ebarasi, L., Betsholtz, C., Schulte-Merker, S., Wolfe, S.A., Lawson, N.D., Reverse Genetic Screening Reveals Poor Correlation between Morpholino-Induced and Mutant Phenotypes in Zebrafish, 97-108, Copyright (2015) with permission from Elsevier. Full text @ Dev. Cell

