Fig. 4
Nuclear TyrRS Protects Cells and Organism from DNA Damage
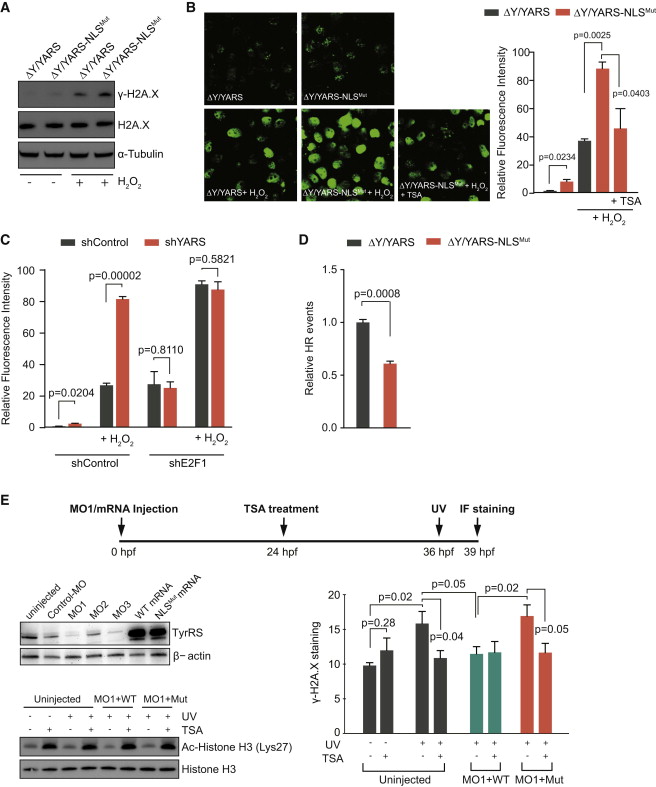
(A) Nuclear TyrRS protects HEK293T cells from H2O2 induced DNA damage. The levels of γ-H2A.X in ΔY/YARS or ΔY/YARS-NLSMut transfected cells, with or without H2O2 treatment (1 hr), were detected with western blot. Total H2A.X and α-tubulin served as loading controls.
(B) Nuclear TyrRS protects against DNA damage in HeLa cells. Cells were treated with H2O2 for 1 hr and immunofluorescently stained for γ-H2A.X, or pretreated with TSA (200 nM) for 12 hr before the H2O2 treatment. Images and fluorescence intensities were analyzed and quantified using ImageJ. The bar graph represents average ± SEM (n = 3).
(C) The DNA damage protection effect of TyrRS depends on E2F1. HeLa cells with or without E2F1 knockdown were transfected with shControl or shYARS constructs. After 1 hr H2O2 treatment, the cells were immunofluorescently stained for γ-H2A.X. Fluorescence intensities were analyzed and quantified using ImageJ. The bar graph represents average ± SEM (n = 3).
(D) Nuclear TyrRS promotes DNA repair by HR. U2OS cells carrying EGFP-HR substrate were transfected with ΔY/YARS or ΔY/YARS-NLSMut and I-SceI constructs. Transfected cells were assayed for EGFP-positive events with fluorescence-activated cell sorting analysis. Graph represents average ± SEM (n = 3).
(E) Protective effect of TyrRS against DNA damage in zebrafish. The knockdown efficiency of synthesized antisense morpholinos (MOs) against the endogenous zebrafish TyrRS and the expression levels of the injected human TyrRS mRNAs were detected with western blot. β-actin served as a loading control. The embryos of zebrafish were injected with MO-1 and synthesized WT or NLSMut TyrRS mRNAs, followed by TSA and UV treatments. Immunofluorescence staining against γ-H2A.X was used to detect DNA damage. The activity of TSA was confirmed by detecting acetylated histone H3 (Lys27) levels in the fish samples. Total histone H3 served as the loading control. The γ-H2A.X foci in each embryo were calculated and analyzed using ImageJ. Graph represents average ± SEM (n = 4 to <8).
See also Figure S4.

