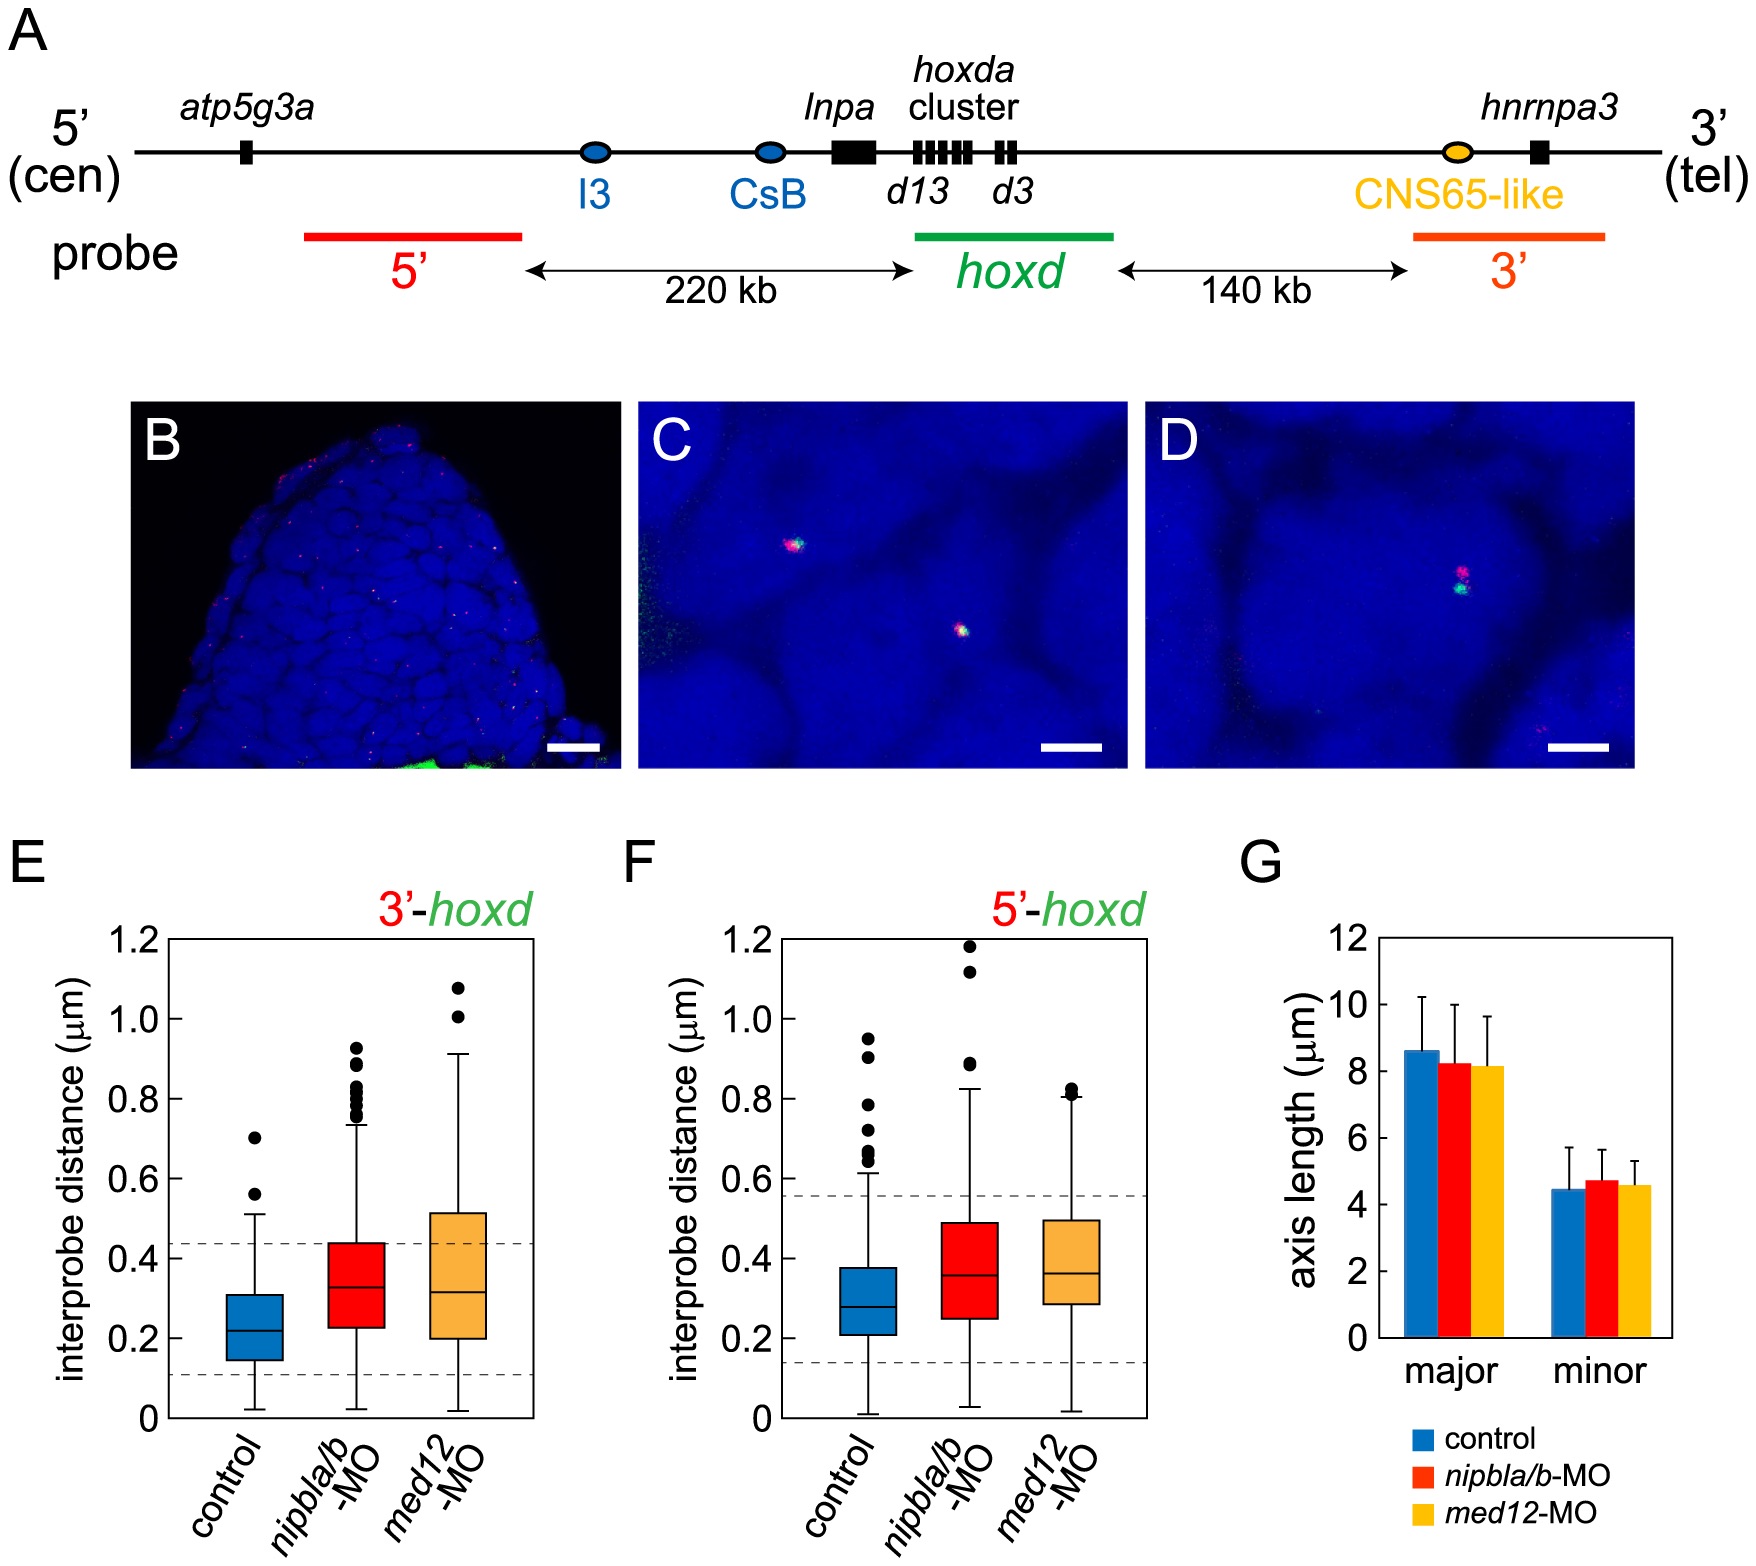
Fig. 9 Nipbls and Med12 play roles in regulation of higher-order chromosome conformation at the Hoxd locus in pectoral fin buds.
(A) Diagram of the genomic organization at the zebrafish hoxda locus. Genes in the hoxda cluster and flanking genes are shown as black boxes. Putative regulatory elements conserved between zebrafish and mouse and probes used for FISH are shown as colored ovals and lines, respectively. (B–D) Typical images of FISH. (B) Low magnification picture of a sagittal section of pectoral fin bud. Scale bar = 10 μm. (C,D) Higher magnification images of nuclei with colocalized (C) and separate signals (D). Hybridized probes are detected as green and red fluorescent dots in DAPI-stained nucleus. Scale bar = 2 μm. (E,F) Whisker plots of interprobe distances between hoxd and 3′ probes (E) or hoxd and 5′ probes (F) at 38 hpf. Medians, numbers of nuclei and embryos, and p-values calculated by the non-parametric Mann-Whitney U-test are shown in Table 2. Dotted lines indicate thresholds for separated (upper) and closed (lower) signals in Table 2. (G) Sizes of nuclei in pectoral fin buds (n = 30 each) were estimated at 38 hpf by measuring major and minor axes. Major axis (Ave ± S.D.): 8.58±1.63 μm (control), 8.22±1.76 μm (nipbla/b-MOs, p = 0.412), and 8.14±1.43 μm (med12-MO, p = 0.280). Minor axis (Ave ± S.D.): 4.41±1.28 μm (control), 4.70±0.92 μm (nipbla/b-MOs, p = 0.314), and 4.56±0.73 μm (med12-MO, p = 0.577). p-values were calculated by Student′s t-test.

