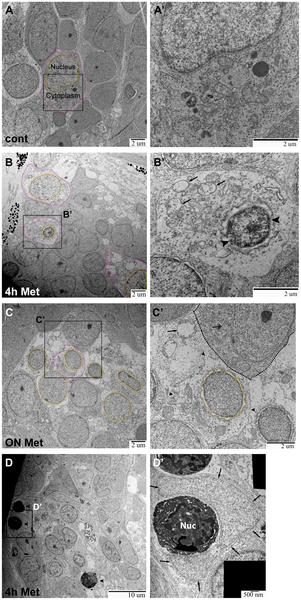
Fig. 5 TEM images of ganglia in Ntr larvae.
A,A′) Ganglia in 5) Individual cell indicated with nucleus (orange) and cytoplasm (magenta) outlined (7500x). A′) Higher magnification of A (15,000x) shows a normal cell. B,B′) Ganglia in 4 dpf Ntr treated with 10 mM Met for 4 h. B) Degenerating cell bodies (nuclei in orange; cytoplasm in magenta) are apparent at this magnification (7500x). B′) Higher magnification of B (15,000x) shows one of these damaged cells. The nucleus (arrowheads) has shrunk and organelles in the cytoplasm (arrows) appear damaged. C,C′) Ntr at 5 dpf after 18 hr- treatment with10 mM Met. C) Damaged cells lacking discreet cell membranes (nuclei in orange) are apparent at this magnification (7500x). Individual cell outlined in magenta. C′) Higher magnification image of C (15,000x) shows one of these damaged cells. The nucleus (orange) appears ruffled and the cell membrane is broken (arrowheads) and irregular. A neighboring healthy cell is indicated (dashed line) containing a normal organelle (double arrow). For comparison, a swollen organelle from a degenerated cell is indicated with an arrow. D,D′) Ganglia in 4 dpf Ntr treated with 10 mM Met for 4 h. D) Dying cells (arrowheads) are apparent at this magnification (4000x). D′) Higher magnification of D (30,000x) shows a dying cell (electron-dense cell body with nucleus (Nuc) being engulfed by a phagocytic cell (arrows).

