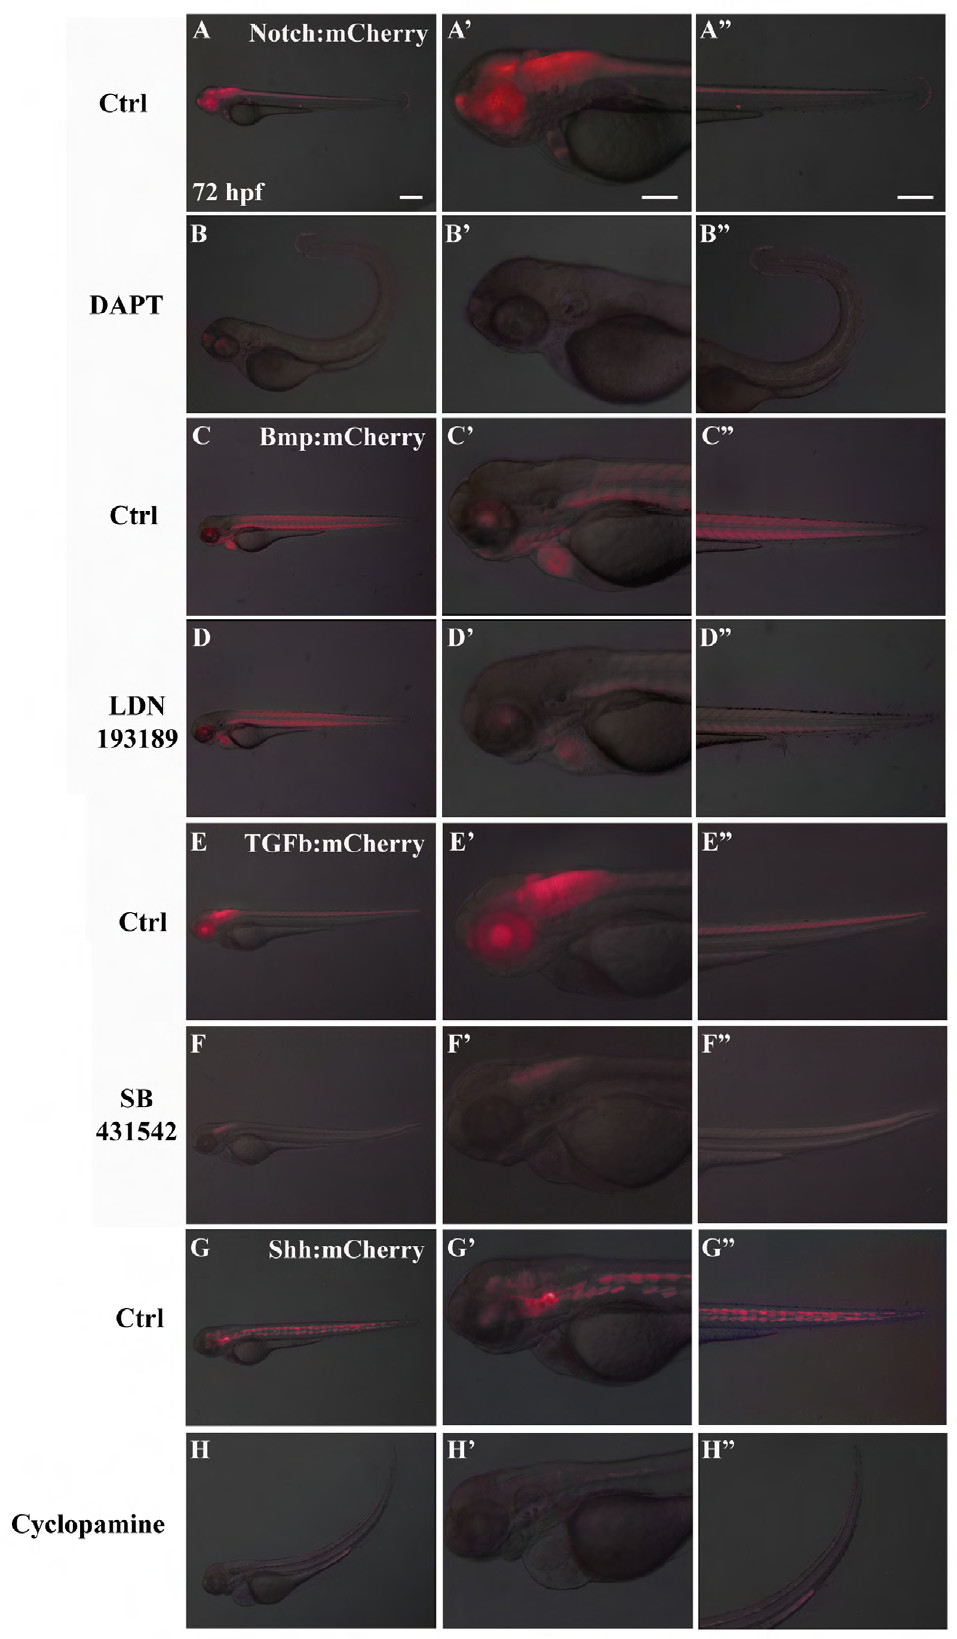
Fig. S4
Validation of mCherry reporter expression. mCherry was expressed under control of ID1 (Bmp signaling); Smad3 (TGFβ signaling); Gli1 (Shh signaling) and Rbpj (Notch signaling). Panels report embryo analysis at 72 hpf for both treated and untreated embryos. Notch signaling is expressed in entire neural tube, pineal gland, eyes, cardiac valves and tail (A-A′′); Bmp signaling is expressed in muscle fibers, eyes, gill arches, heart (C-C′′); TGFβ signaling is expressed in neural tube except midbrain and forebrain and eyes (E-E′′); Shh signaling is expressed in nothocord, midbrain, hindbrain and eyes (G-G′′). Embryos were treated with specific pathways inhibitors: DAPT for Notch signaling (panels B-B′′), LDN193189 for Bmp signaling (panels D-D′′), SB431542 for TGFβ signaling (panels F-F′′), Cyclopamine for Shh signaling (panels H-H′′). A′-H′ and A′′-H′′ are magnifications of A-H. Scale bar is 50 μm for all pictures. Images are representative. Even considering the initial variability of reporter expression, we could observe significant reduction (more than 75%) of the fluorescence in all embryos analyzed for each reporter line treated with specific inhibitors (n>100/line).

