
Image
|
Figure Caption
Fig. 9
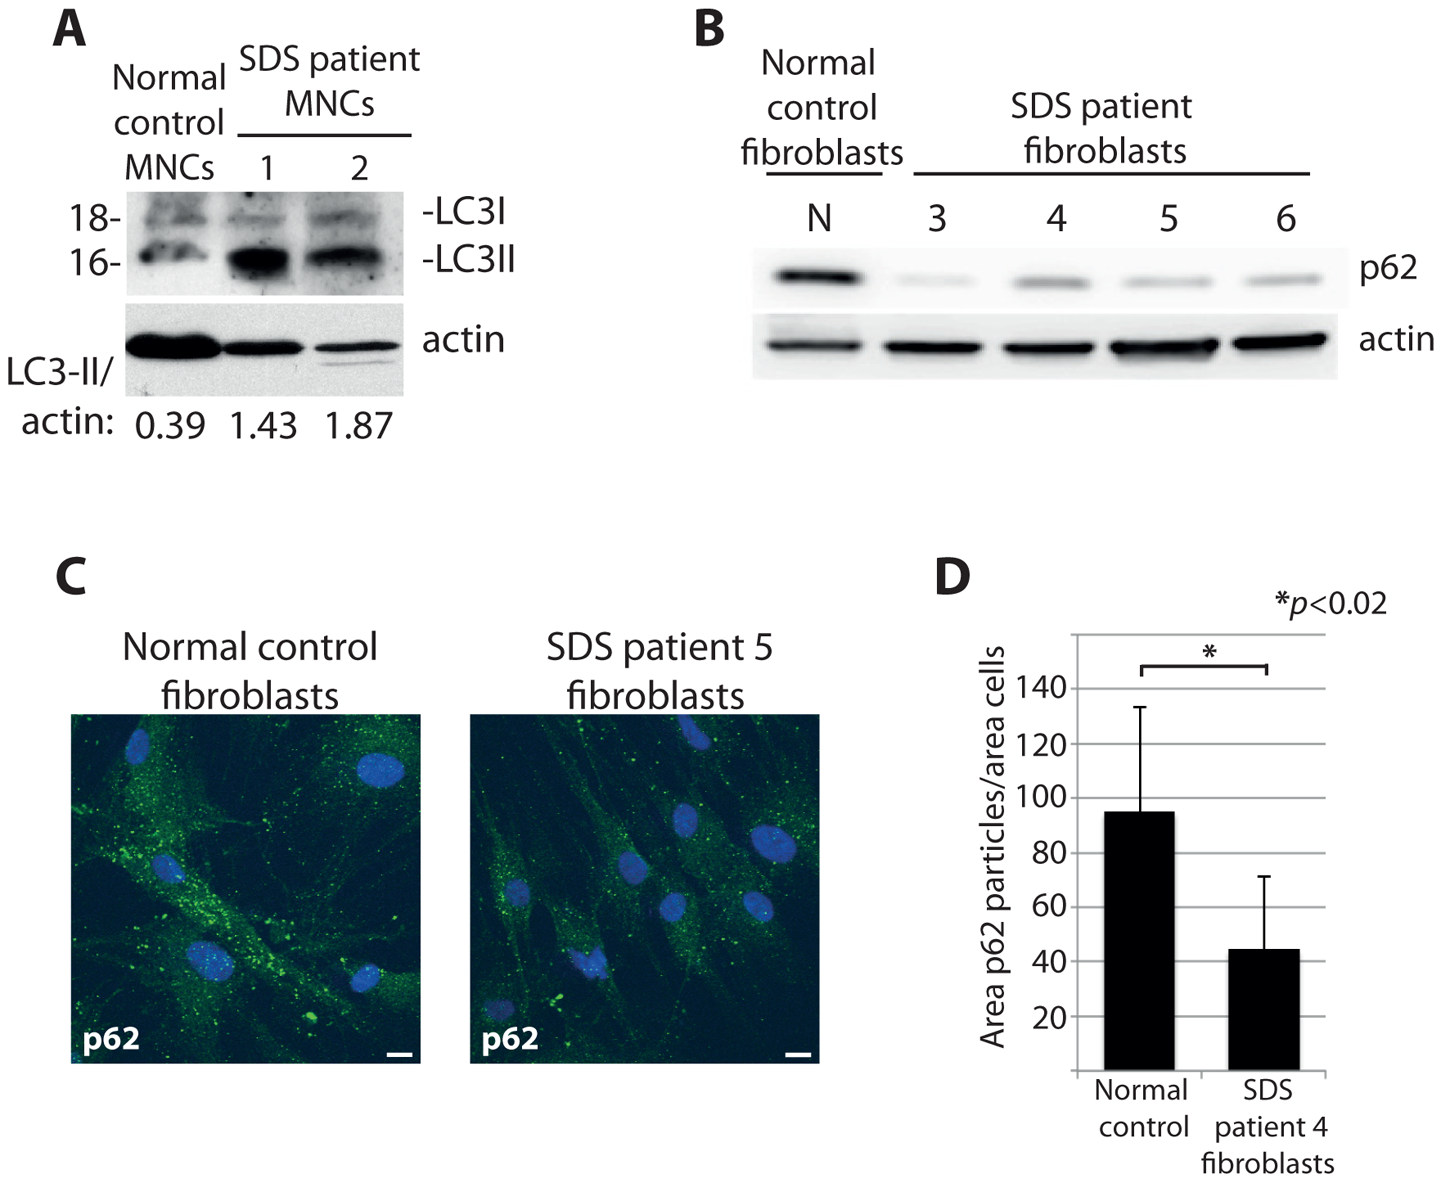
Cells from SDS patients reveal increased autophagy.
(A) Western blot analysis of LC3 in primary MNCs isolated from two independent SDS patient peripheral blood. (B) Western blot analysis of p62 levels in primary fibroblasts isolated from four independent SDS patients. (C) Confocal analysis of p62 levels in SDS fibroblasts, quantified in (D). At least 8 shots from 3 independent experiments are quantified.
Acknowledgments
This image is the copyrighted work of the attributed author or publisher, and
ZFIN has permission only to display this image to its users.
Additional permissions should be obtained from the applicable author or publisher of the image.
Full text @ PLoS Genet.