
|
Fig. 1
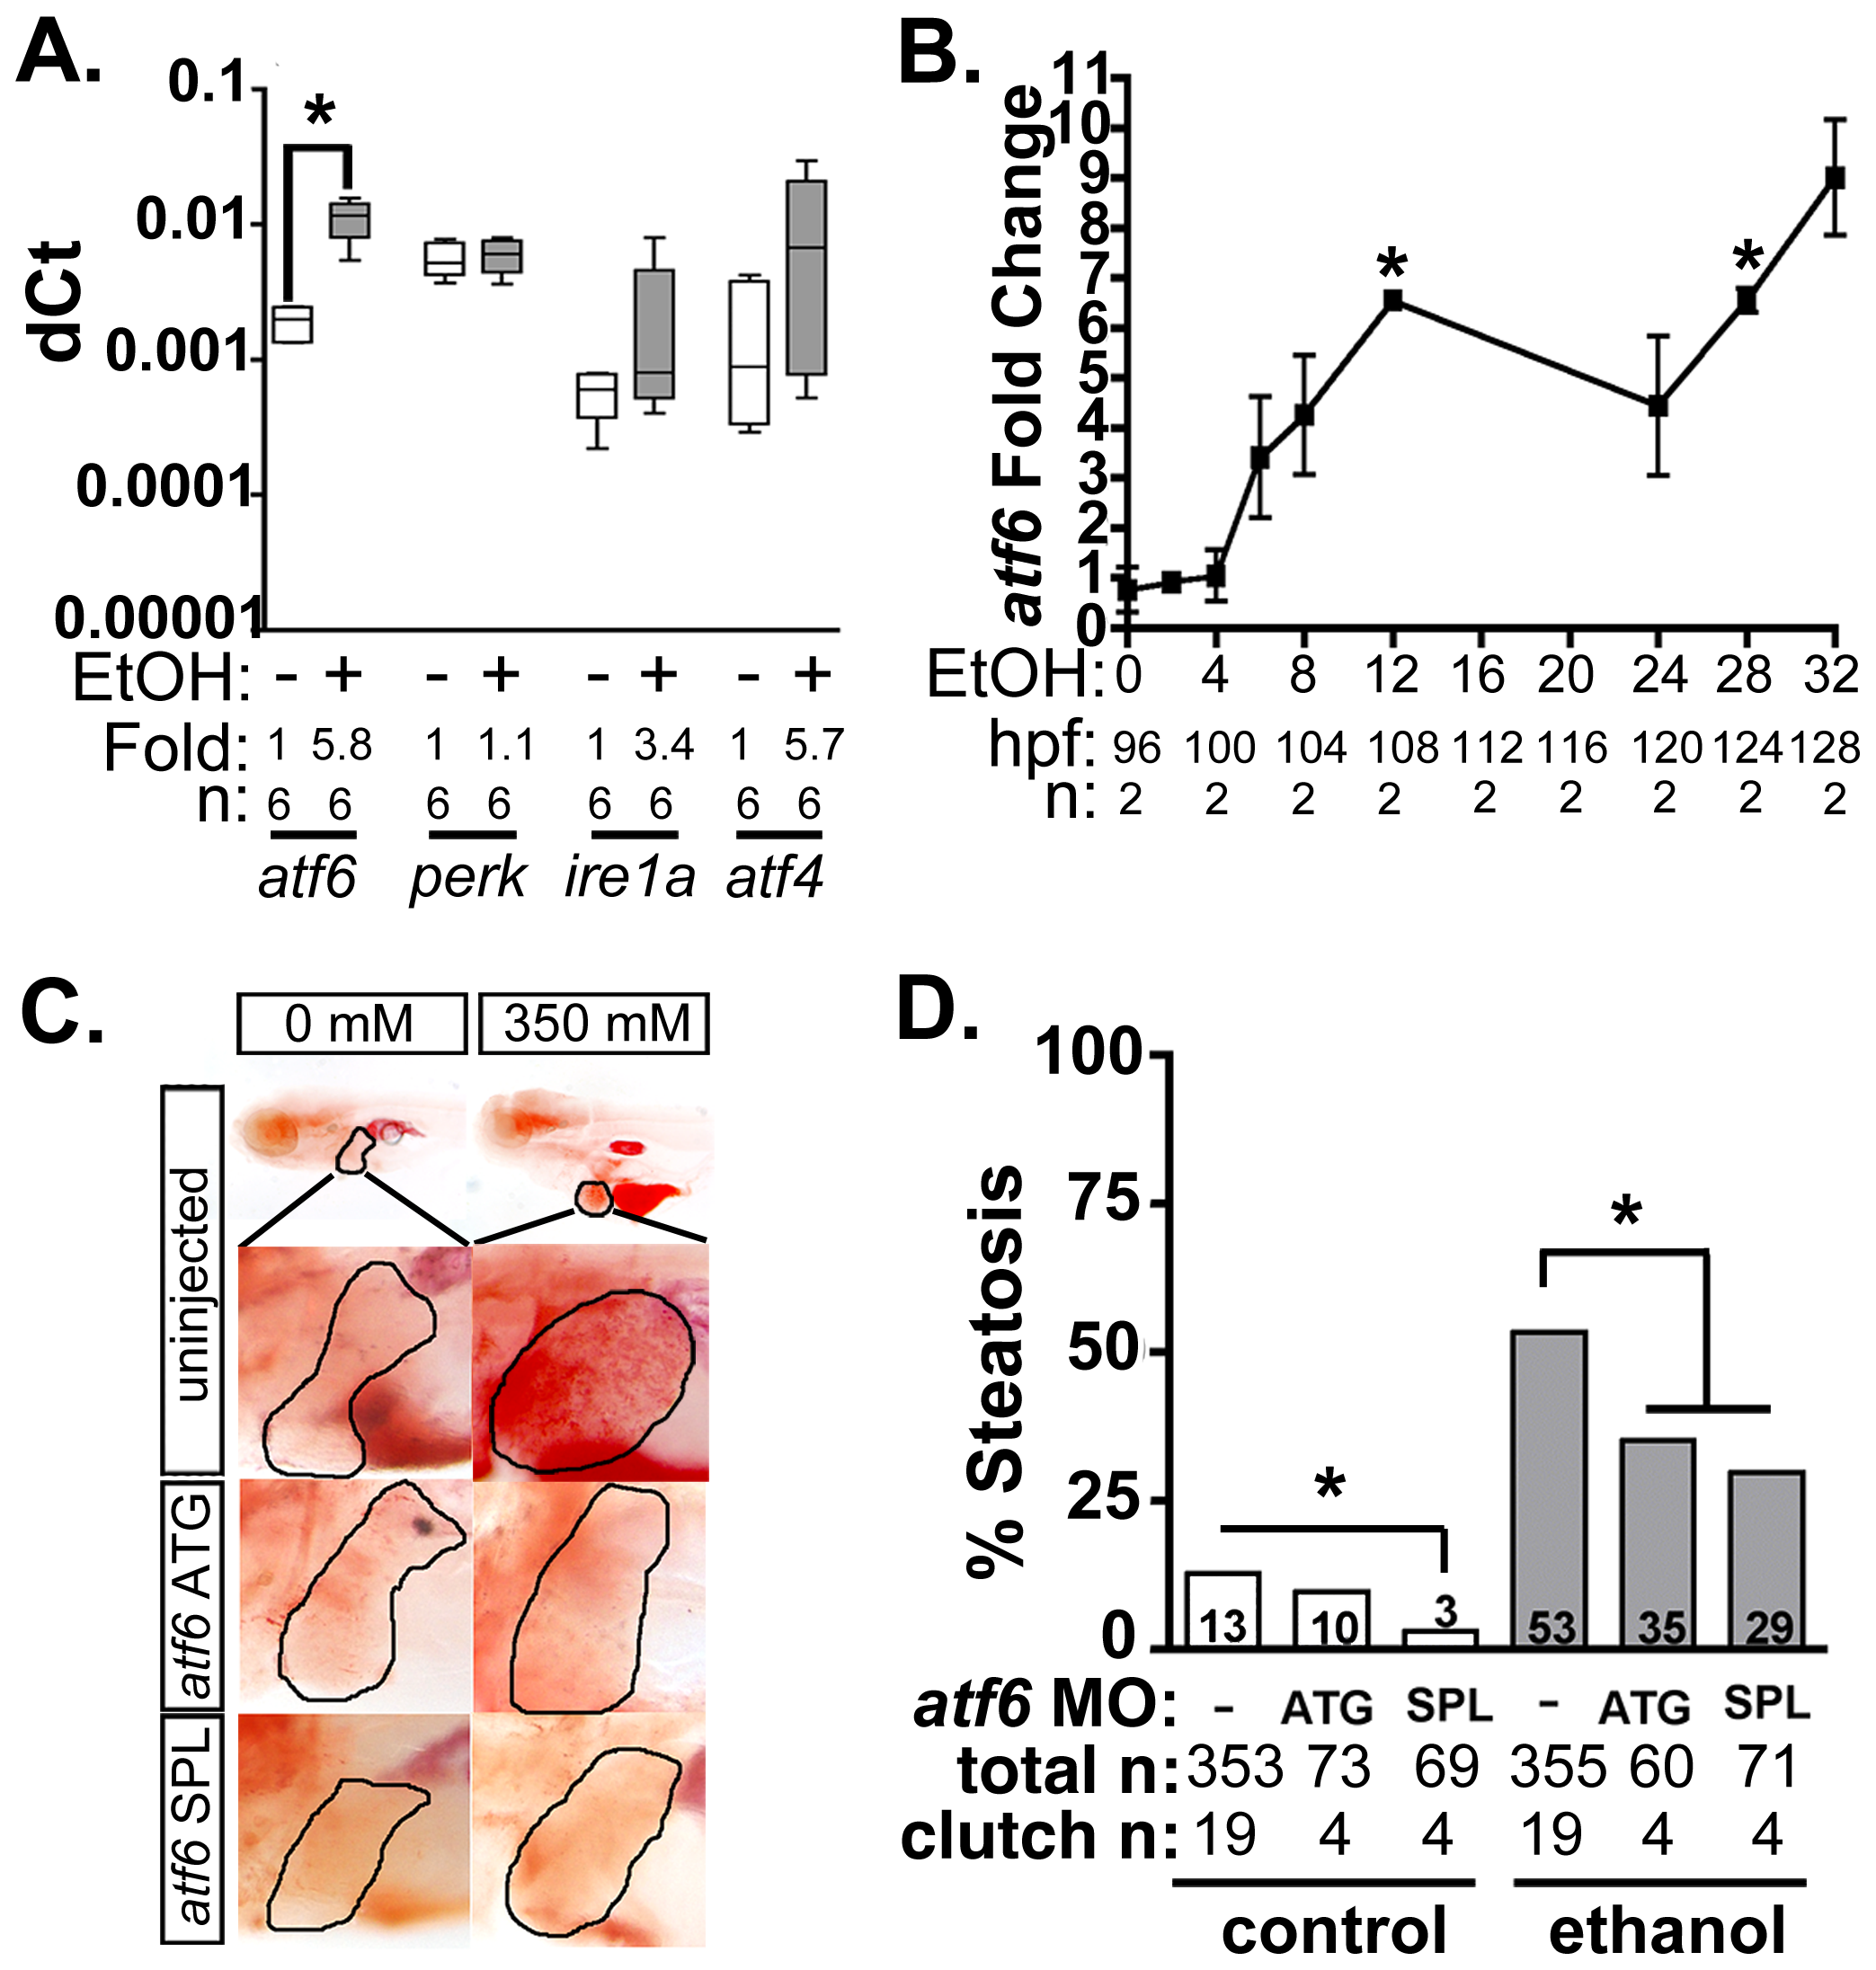
Atf6 is required for alcoholic steatosis.
A: qPCR analysis of UPR sensors atf6, perk, ire1a, and atf4 in the livers of control (EtOH-) and 350 mM ethanol-treated (EtOH+) larvae. dCt values were calculated by normalization to rpp0. Fold changes were calculated based on median dCt values. Statistics: paired t-test. *, p<0.05. B: Expression of atf6 in the livers of 350 mM ethanol treated larvae from 0–32 hours. Fold changes were determined by normalizing to control (0 mM EtOH) dCt values. Statistics: one-sample t-test. *, p<0.05. C: Images of oil red O stained whole larvae injected with two different morpholinos targeting atf6 (ATG-targeting, atf6 ATG, and splice-blocking, atf6 SPL) and exposed to either 0 or 350 mM ethanol. Livers are circled in the enlarged boxes. D: Steatosis incidence based on scoring oil red O stained larvae at 5.5 dpf. Statistics: chi-square with Fisher′s Exact Test. *, p<0.05. “Total n” and “clutch n” corresponds to the number of larvae and number of clutches scored.