
|
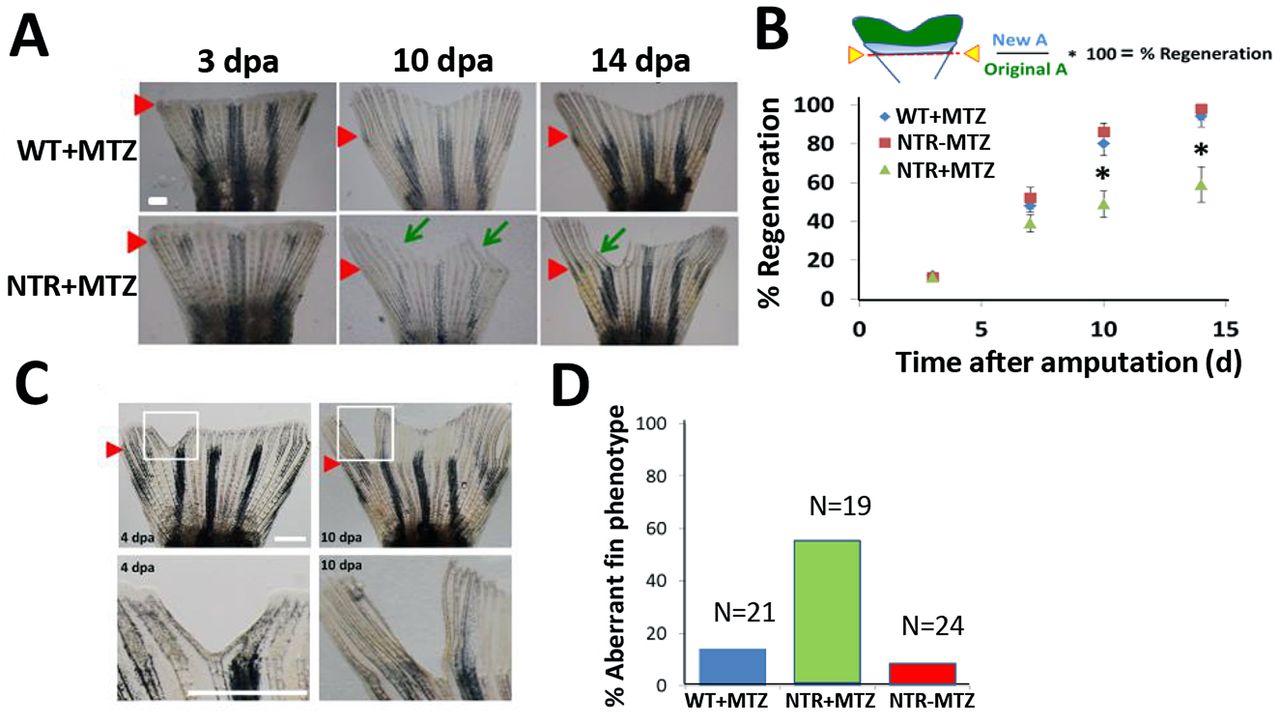
Fig. 2
Macrophages modulate caudal fin regeneration rate and phenotype. (A) Macrophages were continuously ablated after fin resection (up to 14dpa) using the macrophage ablation fish line Tg(mpeg1:NTR-eYFP). Fin images are representative of macrophage-ablated (NTR+MTZ) and control (WT+MTZ) fish in at least three independent experiments. Green arrows point to areas of unusually reduced tissue growth and formation; red arrowheads indicate the original fin cut line. (B) Quantification of regenerated tissue as a percentage of original fin area for NTR+MTZ (n=11), WT+MTZ (n=18) and control fish (NTRMTZ, n=14). Full regeneration to the original fin area is considered 100% regeneration. Data are compiled and averaged over three separate experiments using identical conditions. 10dpa, *P=0.0124; 14dpa, *P=0.0262; two-tailed t-test. Error bars indicate s.e.m. averages of each experiment. (C) Representative images at 4dpa and 10dpa of MTZ-treated Tg(mpeg1:NTR-eYFP) caudal fins displaying aberrant tissue phenotypes. (D) Summary of percentage of fish qualitatively assessed for aberrant phenotypes at 14dpa. Scale bars: 300μm.