
Fig. 3
|
Fig. 3
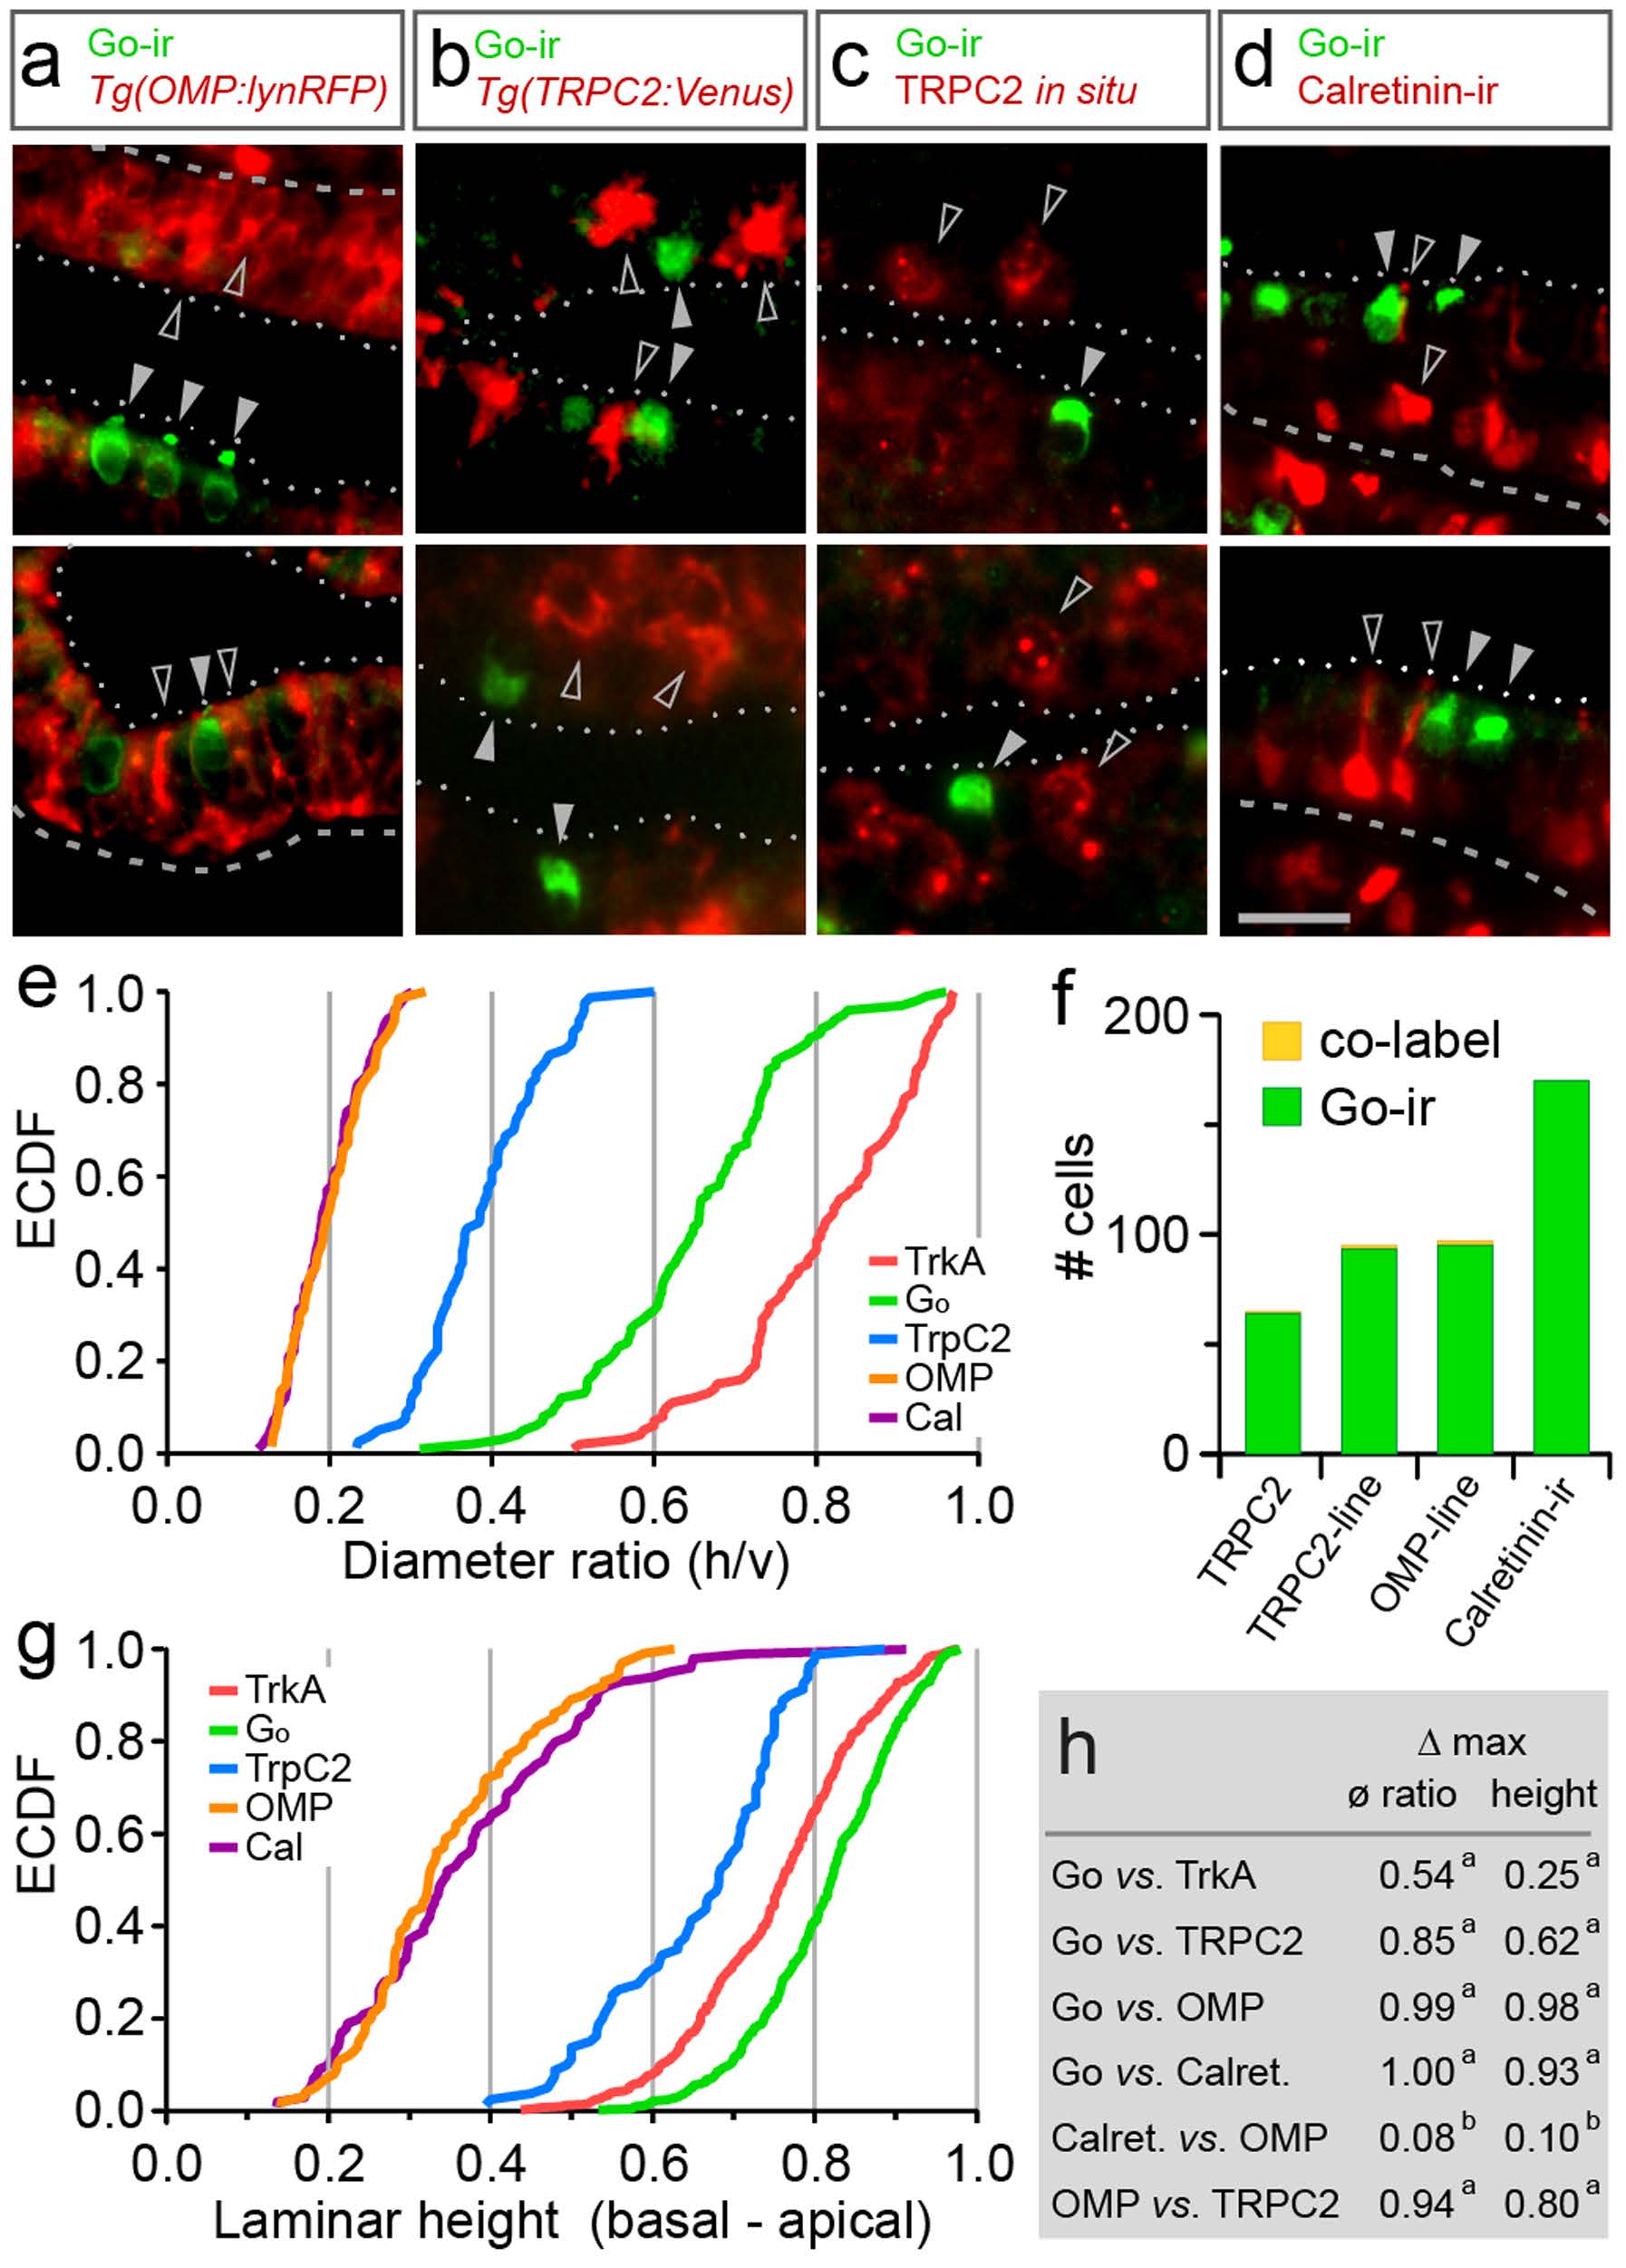
Go-ir-positive neurons do not co-localize with established markers for ciliated and microvillous neurons. (a-d), Double labeling of Go-ir-positive cells with different markers is analysed in horizontal cryostat sections of olfactory epithelia; dashed line, basal border; dotted line, apical border of the sensory layer; scale bar, 20µm. (a) Double fluorescent labeling of anti-Go antibody (green) with RFP (red) expressed in ciliated neurons in Tg(OMP:lyn-mRFP) shows absence of co-localization; filled grey arrowhead, Go-ir-positive cell; open arrowhead, RFP-positive cell. (b) Double fluorescent labeling of anti-Go antibody with Venus expressed in microvillous neurons in Tg(TRPC2:Venus) line shows absence of co-localization. Go-ir signal is set to green, Venus signal is set to red; filled arrowhead, Go -ir-positive cell; open arrowhead, Venus-positive cell. (c) Double fluorescent labeling of anti- Go antibody (green) with in situ hybridisation signal from TRPC2 probe5 shows absence of co-localization; filled grey arrowhead, Go-ir-positive cell; open arrowhead, TRPC2-positive cell. (d) Double fluorescent labeling of anti-Go antibody (green) with anti-calretinin antibody (red) shows absence of co-localization; filled grey arrowhead, Go-ir-positive cell; open arrowhead, calretinin-positive cell. (e) The empirical cumulative distribution function (ECDF) for a cell shape parameter (diameter ratio) shows distributions for TRPC2 and OMP-positive cells to be different from each other as well as from Go-ir and TrkA-ir, shown for comparison here. (f) Quantification of co-label for Go-ir and markers for microvillous, ciliated and crypt neurons (as indicated) shows 0 to 2% co-label (yellow) in Go-ir-positive neurons. Such small percentages amount to a handful of cells in an entire olfactory epithelium, and are likely to accrue from the dense packing of cells, dendrites, cilia and microvilli, at the limit of light-microscopic resolution. (g) The empirical cumulative distribution function (ECDF) for a cell localisation parameter (laminar height) shows distributions for TRPC2 and OMP-positive cells to be different from each other as well as from Go-ir and TrkA-ir-positive cells, shown for comparison here. (h) Maximal vertical distance (Δ max) of distributions as indicated; ø ratio, diameter ratio; height, normalized laminar height. Significance of distribution differences is assessed by Kolmogorov-Smirnov test of the unbinned distributions; a, p < 10-6; b, p > 0.6.