
|
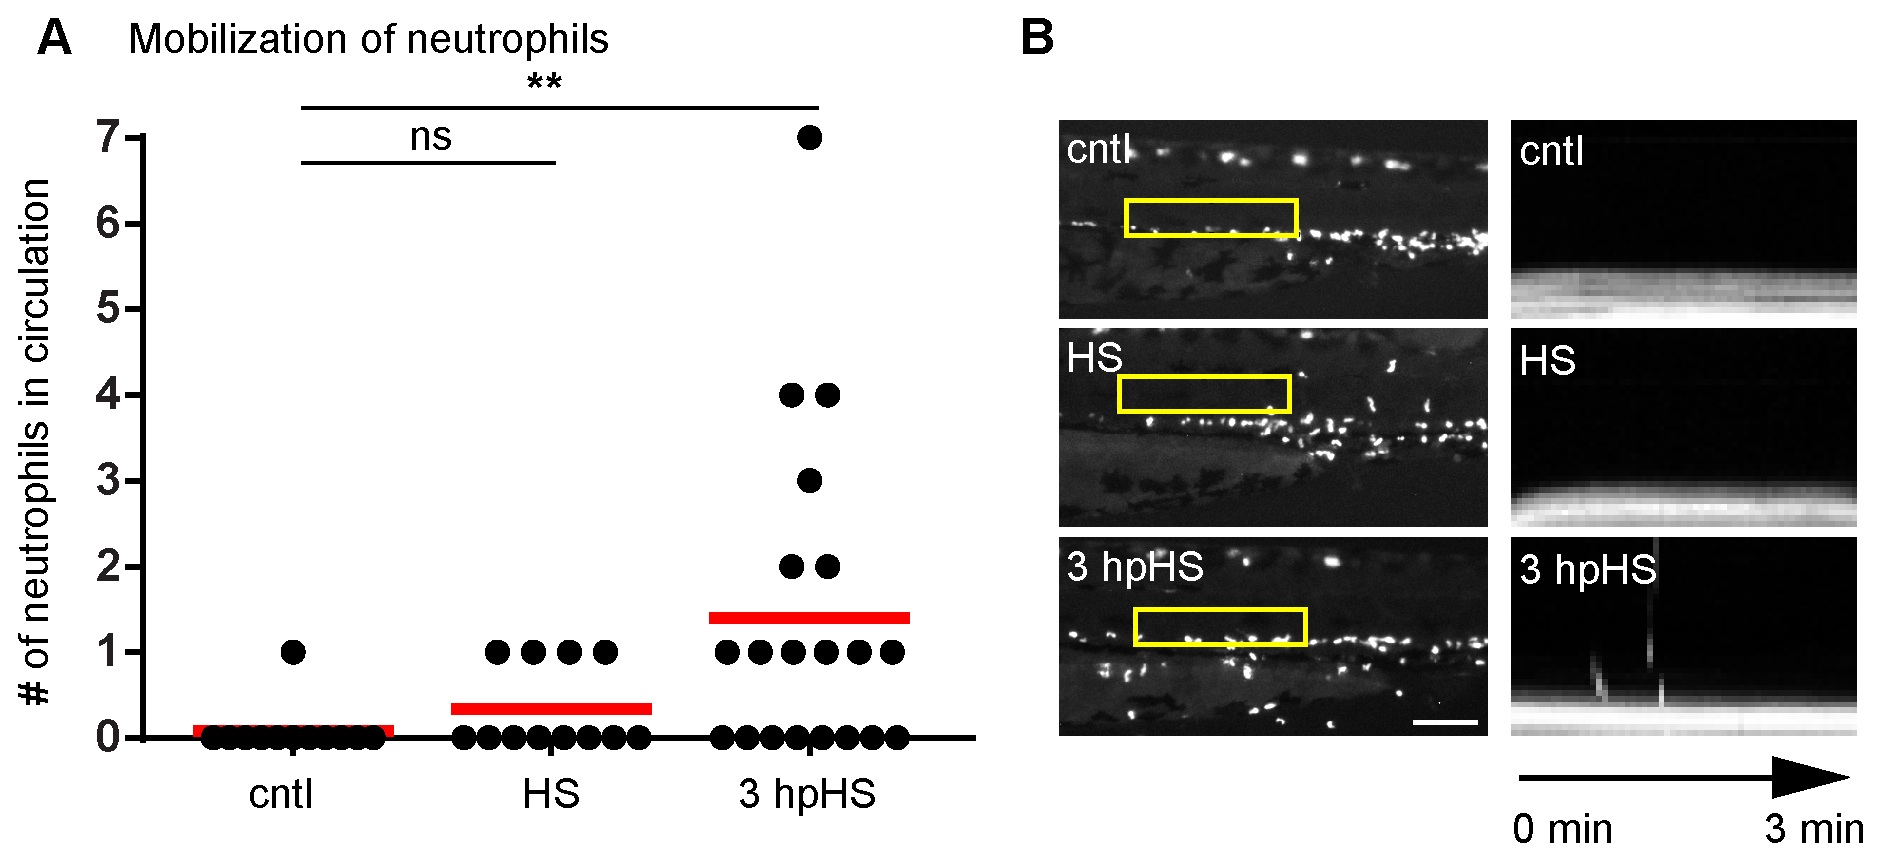
Fig. 3
Heat shock induces neutrophil mobilization.
(A) Quantification of circulating neutrophils in larvae at 3 dpf. There was an increase in circulating neutrophils at 3 hpHS. **P<0.01; ns, not significant (one way ANOVA with Dunn’s multiple comparison test). (B) (Left panel) Yellow box indicates area where kymograph was generated. Fluorescent signal in boxed region was stacked vertically into a one-dimensional line at each time point. Scale bar = 100 μm. (Right panel) Kymograph of 3 minute movies with a 3 second interval indicating the presence or absence of circulating neutrophils is shown. Data are representative of at least three experiments.