
Image
|
Figure Caption
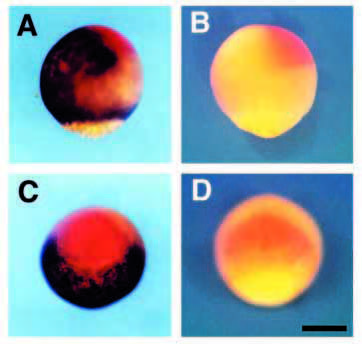
Fig. 1 Comparison of the expression domain of zbmp-2 with that of otx-2. (A,C) At 80% epiboly, zbmp-2 (brown) and otx-2 (red) are expressed in contact with each other in the ectodermal region. (B,D) Embryos hybridized with an antisense probe for otx-2 (red) and a sense probe for zbmp-2. (A,B) Lateral views are oriented with the dorsal side to the right. (C,D) Animal pole views show the dorsal side up. Scale bar, 200 7mu;m.
Figure Data
Acknowledgments
This image is the copyrighted work of the attributed author or publisher, and
ZFIN has permission only to display this image to its users.
Additional permissions should be obtained from the applicable author or publisher of the image.
Full text @ Development