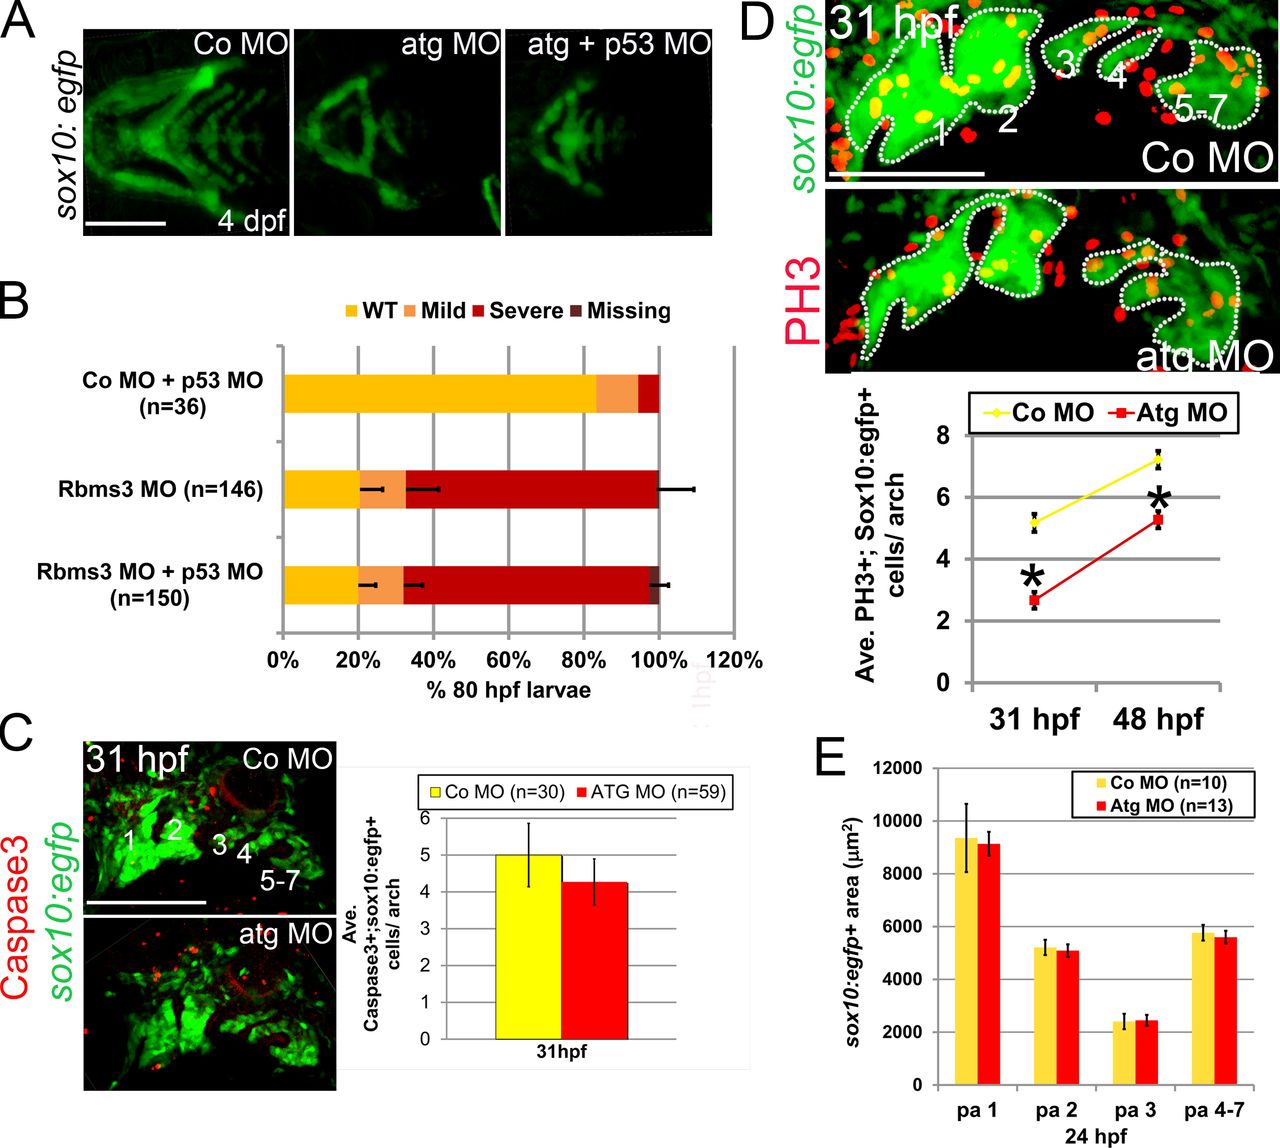
Fig. 6 Cell proliferation is defective in rbms3 morphants. (A and B) Co-injection of Atg MO with p53 MO does not rescue the cartilage phenotype. (A) Ventral views of MO-injected fish. (B) Quantitation of the cartilage phenotype: Atg MO coinjected with p53 MO. P > 0.05 (Χ2 test). n = number of larvae pooled from three experiments. Error bars indicate SD. (C) There is no difference in activated Caspase-3 (red) expression in the pharyngeal arches (green; 1–7) in rbms3 morphants. Lateral view of MO-injected sox10:egfp fish at 31 hpf and quantitation of bifluorescent activated Caspase-3+;sox10:egfp+ cells. Error bars indicate SEM. P = 0.5 (Student’s t test). (D) Cell proliferation marker PH3 (red) is reduced in rbms3 morphant pharyngeal arches (green; 1–7). Lateral view of MO-injected sox10:egfp fish at 31 hpf and quantitation of bifluorescent PH3+ and sox10:egfp+ cells in the pharyngeal arches at 31 and 48 hpf. Error bars indicate SEM. *, P < 0.0001 (Student’s t test). (E) Domain of pharyngeal arch (pa) sox10:egfp expression is comparable between MO treatments at 24 hpf. Error bars indicate SD. n = number of fish (B–E). Bars: (A and C) 200 µM; (D) 100 µM.
Image
Figure Caption
Figure Data
Acknowledgments
This image is the copyrighted work of the attributed author or publisher, and
ZFIN has permission only to display this image to its users.
Additional permissions should be obtained from the applicable author or publisher of the image.
Creative Commons License (Attribution–Noncommercial–Share Alike 3.0 Unported license, as described at http://creativecommons.org/licenses/by-nc-sa/3.0/ ).
Full text @ J. Cell Biol.

