Fig. 6
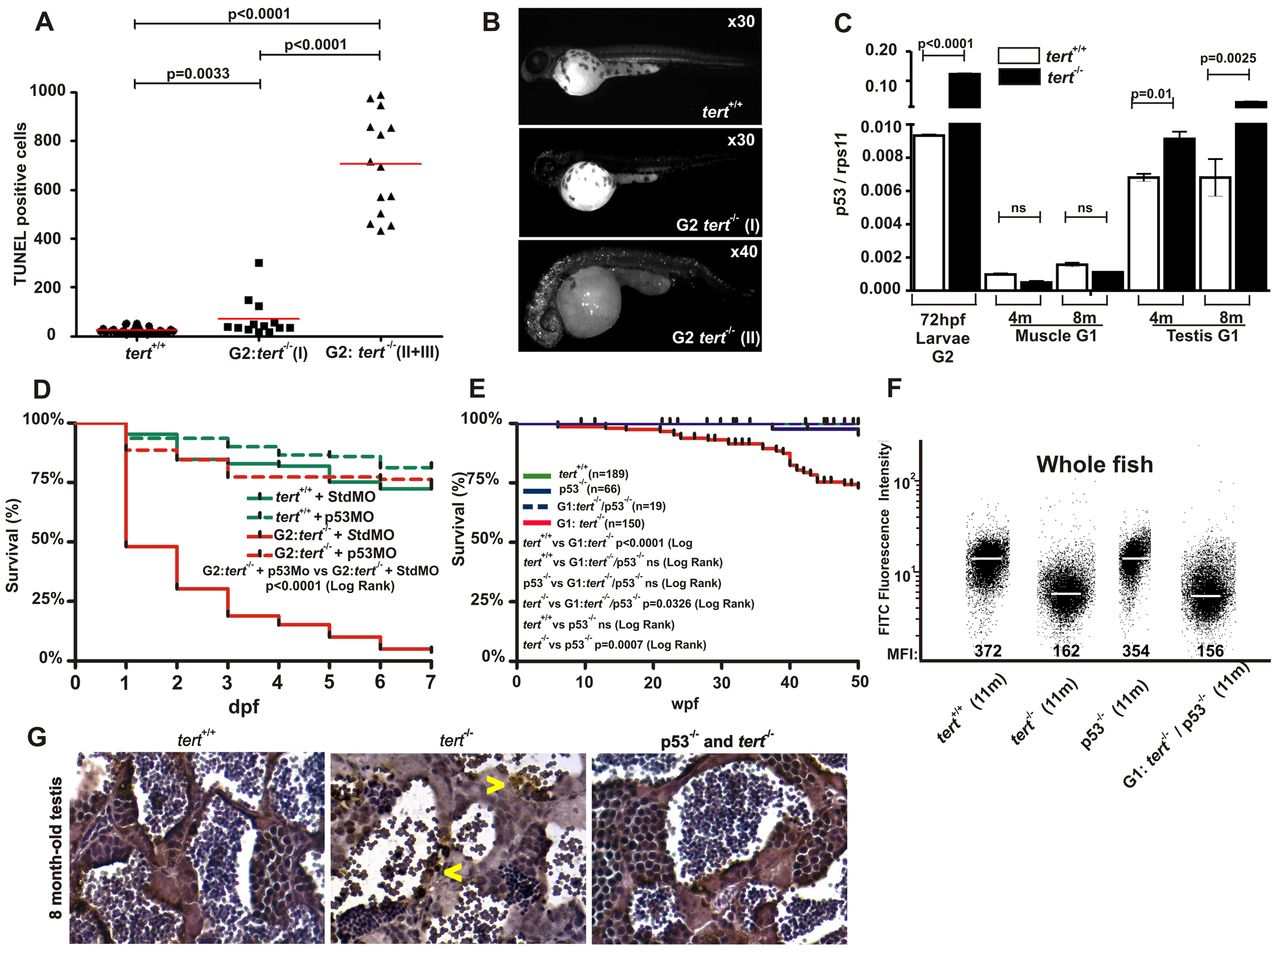
p53 is responsible for the induction of apoptosis, developmental malformations and mortality of G1 and G2tert mutant zebrafish. (A) Quantification of apoptotic cells based on TUNEL staining (see Materials and Methods). Significance was determined based on Student’s t-test (P<0.005). (B) Examples of embryos after TUNEL staining. (C) The mRNA levels of the p53 gene were determined by real-time RT-PCR in 72-hpf larvae, and muscle and testis tissues of adult zebrafish, in the indicated genotypes. Gene expression is normalized against rps11. Each bar represents the mean ± s.e.m. from 100 pooled animals for larvae and three individual fish for adult tissue and triplicate samples. (D) Survival of G2 tert-/- larvae microinjected at the one-cell stage with a morpholino against p53. (E) Kaplan-Meier representation of the survival of four genetic backgrounds. Post-hatching time is shown in weeks. The Log Rank test was used for statistical analysis. (F) Representation of total cell distribution from the four genotypes at the same age (11 months old) according to their telomere length. Medium fluorescence intensity (MFI) is indicated for each genetic background. The same trend was observed in the three independent experiments. (G) TUNEL assay in zebrafish testis sections from 8-month-old wild-type, tert mutant and double-mutant tert-/-; p53-/- zebrafish (400×). Arrowheads indicate apoptotic cells.

