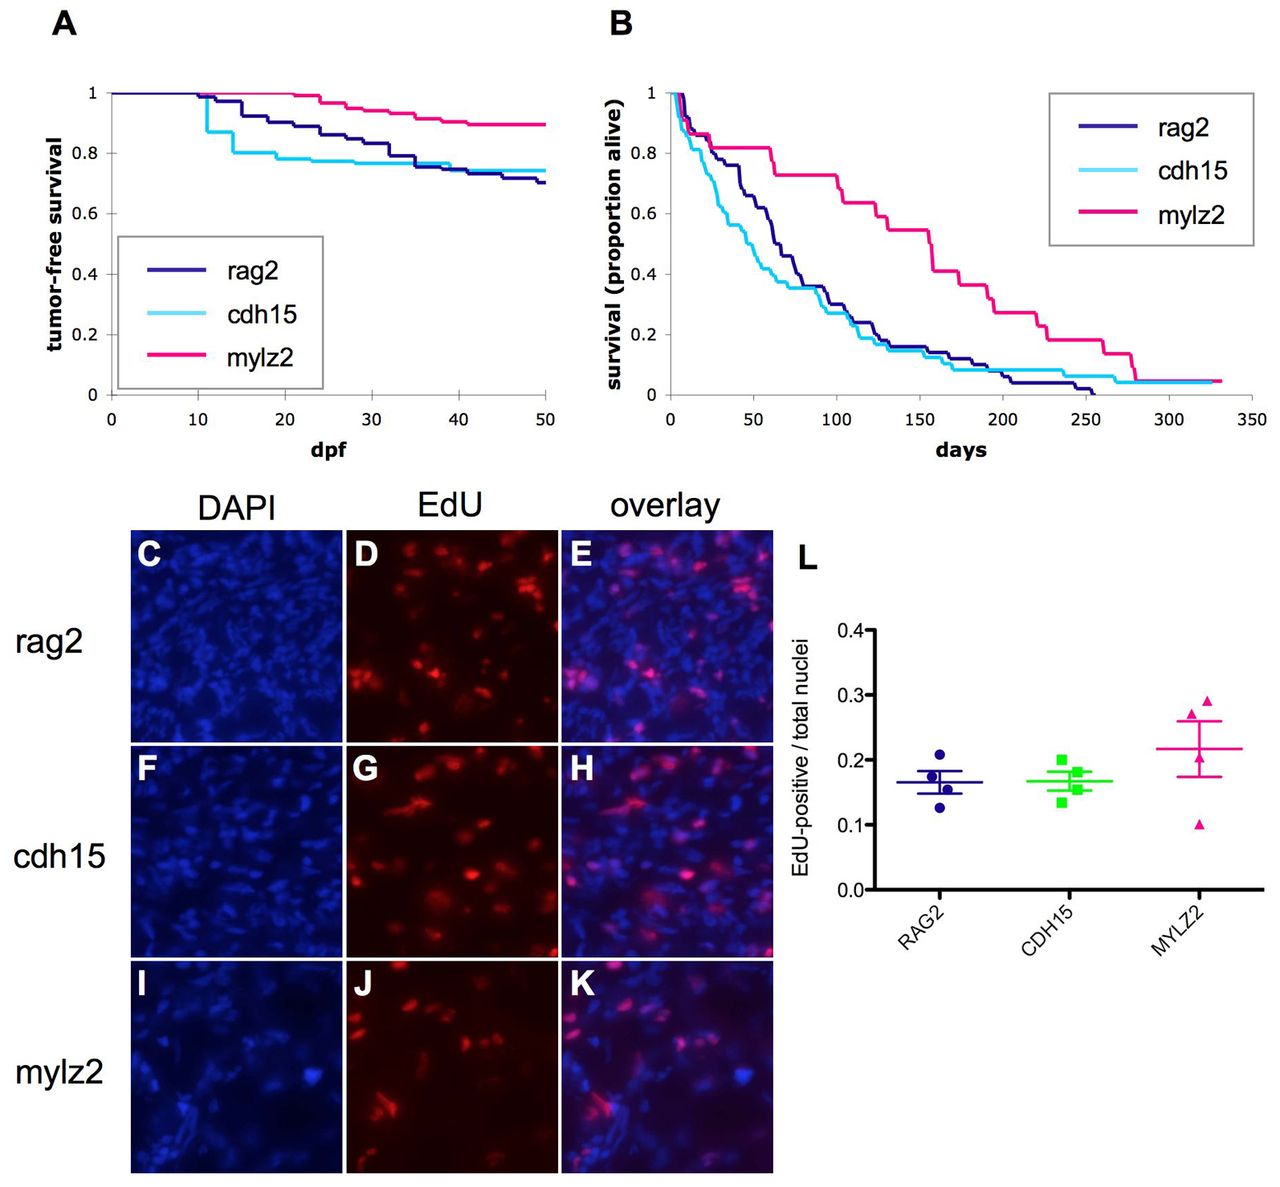
Fig. 4 Survival of tumor-bearing fish differs in rag2, cdh15 and mylz2 tumors. (A) Fish injected with rag2:KRASG12D, cdh15:KRASG12D or mylz2:KRASG12D transgenes developed tumors with differing latency and incidence (mylz2, n=19/117; rag2, n=50/144; cdh15, n=42/146 fish developed tumors; rag2 versus mylz2, P=0.0004; cdh15 versus mylz2, P<0.0001; rag2 versus cdh15, P=0.73). (B) mylz2 tumor-bearing fish displayed better survival over time compared with rag2 and cdh15 tumor-bearing fish (rag2, n=50; cdh15, n=48; mylz2, n=22; rag2 versus mylz2, P=0.001; cdh15 versus mylz2, P=0.009; rag2 versus cdh15, P=0.72). P-values for A and B were calculated using the log-rank test. (C-L) Rates of EdU incorporation did not significantly differ among the tumor models. Fluorescent microscopic images depicting DAPI-positive (C,F,I) and EdU-positive (D,G,J) nuclei. (E,H,K) Merged images. (C-E) rag2 tumor. (F-H) cdh15 tumor. (I-K) mylz2 tumor. (L) Quantification of the ratio of EdU-positive to total nuclei. n=4 for each tumor model; P>0.05, Student’s t-test. Ratios were calculated based on the average ratio for three separate high-power images per tumor. Error bars represent s.e.m.
Image
Figure Caption
Acknowledgments
This image is the copyrighted work of the attributed author or publisher, and
ZFIN has permission only to display this image to its users.
Additional permissions should be obtained from the applicable author or publisher of the image.
Full text @ Development

