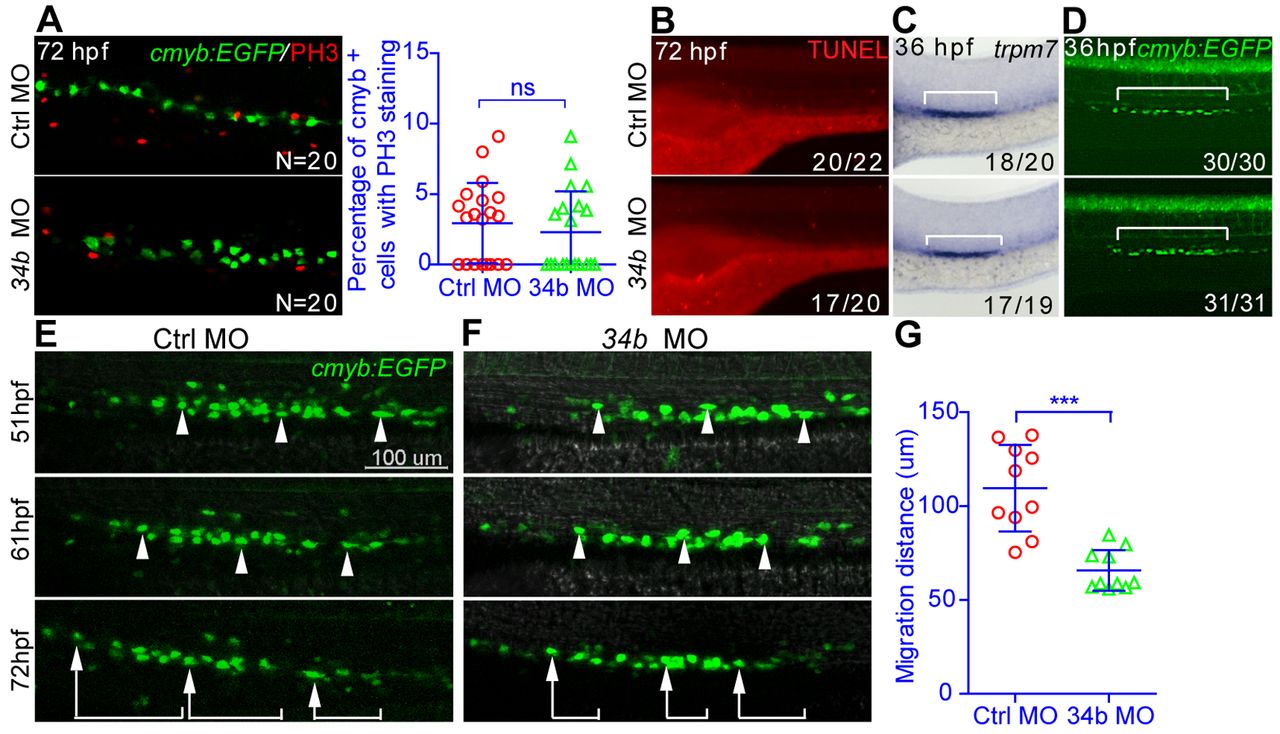
Fig. 3 MCC accumulation is mainly caused by attenuated cell migration. (A) A magnified lateral view of the kidney region after double staining of cmyb:EGFP and PH3 in 3-dpf embryos. (B) A magnified lateral view of the kidney region after TUNEL staining in 3-dpf embryos. (C,D) Distribution of transporting epithelial cells (bracket) (C) and MCCs (D) labeled by trpm7 (WISH) and Tg(cmyb:EGFP) at 36 hpf. (B-D) The number of embryos with normal TUNEL staining, trpm7 expression pattern or cmyb expression pattern among all analyzed embryos is indicated (bottom right). (E-G) The migration of MCCs labeled by Tg(cmyb:EGFP) from 51 to 72 hpf. Three representative MCCs were labeled (arrowheads and brackets) in embryos injected with either control (Ctrl) MO (E) or miR-34b MO (F). The migration distance of each MCC is shown in G (each circle/triangle represents an MCC, n=10). Mean ± s.d. ***P<0.0001 (unpaired t-test); ns, not significant. Scale bar: 100 μm.
Image
Figure Caption
Figure Data
Acknowledgments
This image is the copyrighted work of the attributed author or publisher, and
ZFIN has permission only to display this image to its users.
Additional permissions should be obtained from the applicable author or publisher of the image.
Full text @ Development

