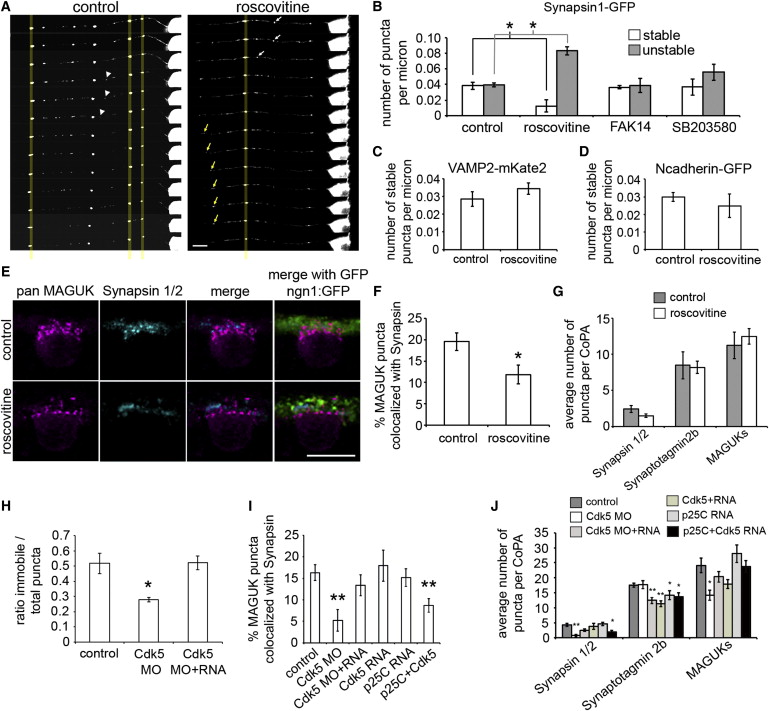
Fig. 7 Cdk5 Regulates Synapsin Stabilization at Synapses (A) Selected frames from 1 hr time lapse movies of synapsin1-GFP expressing RB axons treated with either vehicle (control, left panel) or roscovitine (right panel). Scale bar represents 10 μm. (B) Histogram quantifying the number of stable and unstable puncta per micron for each treatment condition. (C and D) Histograms showing the number of stable puncta per micron in control and roscovitine treatment conditions in VAMP2-mKate2 expressing RB axons (C) and in N-cadherin-GFP expressing axons (D). (E) Dorsal view of IF labeling in 26 hpf ngn1:GFP (green) expressing embryos with antibodies for pan MAGUK (magenta) and synapsin 1/2 (cyan). Scale bar represents 10 μm.(F) Histogram showing the percentage of MAGUK puncta colocalized with synapsin puncta. (G) Histogram showing the average number of synapsin 1/2, synaptotagmin2b, and MAGUK puncta per CoPA cell for both control and roscovitine treatment conditions. (H) Histogram showing the ratio of stable to total synapsin1-GFP puncta in control, Cdk5 MO, and Cdk5 MO and RNA-injected embryos. (I) Histogram showing the percentage of MAGUK puncta colocalized with synapsin puncta in control, Cdk5 MO, Cdk5 MO and RNA, Cdk5 RNA, p25C RNA, and p25C and Cdk5 RNA-injected embryos. (J) Histogram showing the average number of synapsin 1/2, synaptotagmin2b, and MAGUK puncta for control, Cdk5 MO, Cdk5 MO and RNA, Cdk5 RNA, p25C RNA, and p25C and Cdk5 RNA-injected embryos. Error bars show SEM. p < 0.05 and p < 0.005 as compared to control condition.
Image
Figure Caption
Acknowledgments
This image is the copyrighted work of the attributed author or publisher, and
ZFIN has permission only to display this image to its users.
Additional permissions should be obtained from the applicable author or publisher of the image.
Full text @ Cell Rep.

