
|
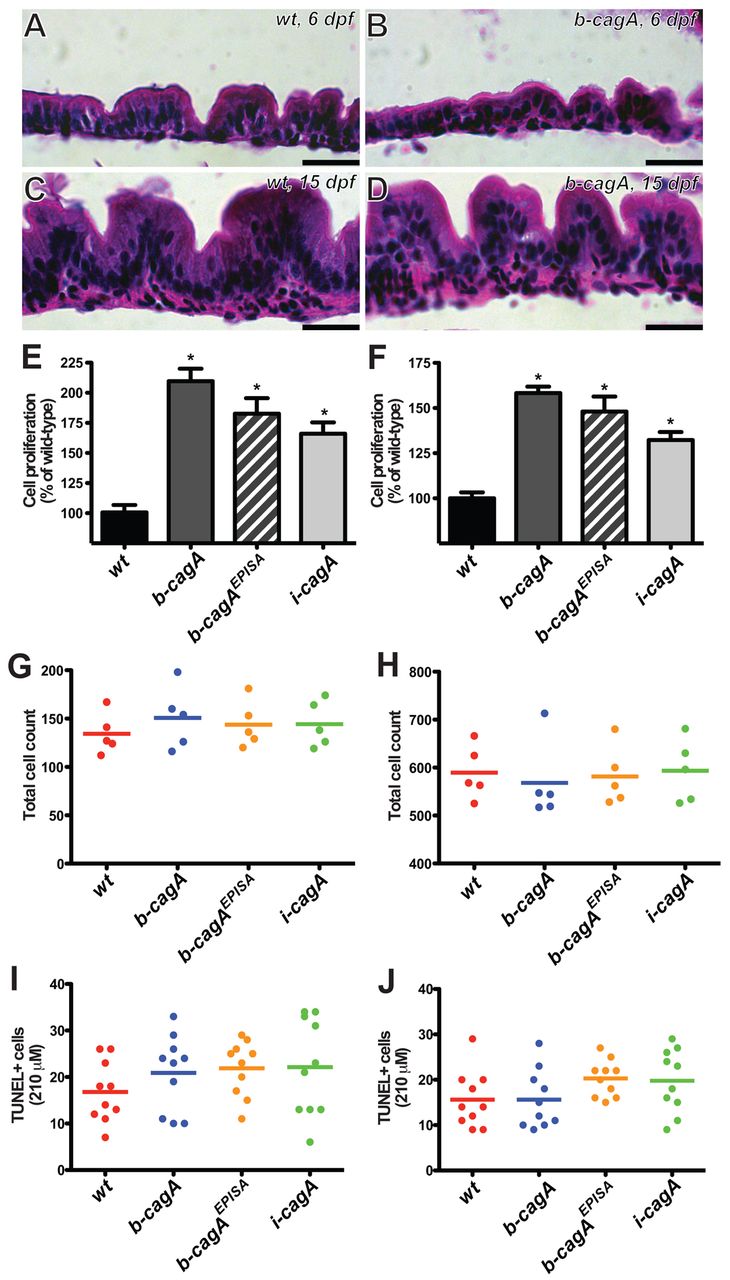
Fig. 2 CagA expression causes overproliferation of the intestinal epithelium. (A,B) H&E stained sagittal sections of wild-type (A) and b-cagA transgenic (B) zebrafish intestine at 6 dpf. (C,D) H&E stained sagittal sections of wild-type (C) and b-cagA transgenic (D) zebrafish intestine at 15 dpf. (E,F) Intestinal epithelial cell proliferation at 6 dpf (E) and 15 dpf (F). Bars represent proliferation (mean ± s.e.m.) as a percentage of wild-type; n=10, *P<0.05 using one-way ANOVA with Tukey’s test. (G,H) Total intestinal epithelial cell counts of single H&E stained midline sagittal sections at 6 dpf (G) and 15 dpf (H). (I,J) TUNEL-positive cells in the intestinal epithelium at 6 dpf (I) and 15 dpf (J). Scale bars: 10 μm.