
Image
|
Figure Caption
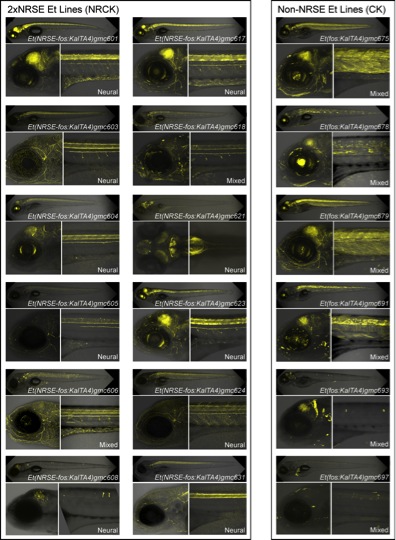
Fig. S2 Enhancer trap comparisons ±NRSE. Confocal images of an additional 12 NRCK (left box) and 6 CK (right box) lines are shown in support of the phenotypic data summarized in Figure 1S. Each line is designated by a transgenic allele number (e.g., gmc601) and with the phenotypic characterization (e.g., Neural, Mixed, Non-Neural) provided in the lower right of each image set. Additional high resolution imaging data is available on line at [47].
Acknowledgments
This image is the copyrighted work of the attributed author or publisher, and
ZFIN has permission only to display this image to its users.
Additional permissions should be obtained from the applicable author or publisher of the image.
Full text @ BMC Biol.