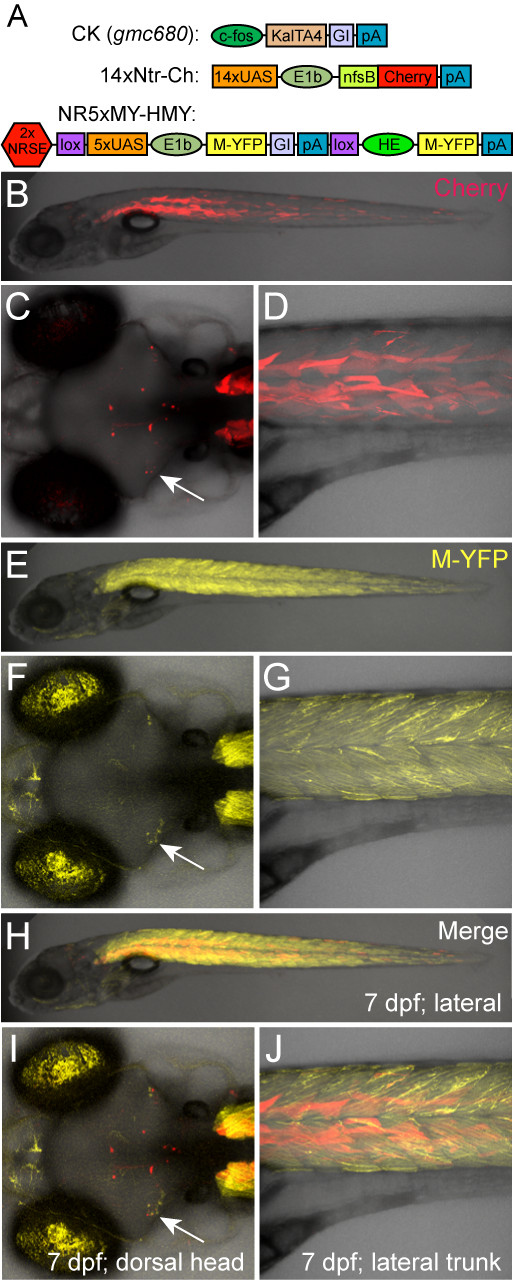
Fig. 3 UAS reporter comparison αNRSE. Plasmid diagrams and representative confocal images at 6 dpf of a triple transgenic larva where Gal4 is driving two reporters αNRSE, a non-NRSE mCherry reporter line (B-D, 14xNTR-Ch (c264)) and a NRSE-containing YFP reporter line (E-G, NR5xMY-HMY (gmc932), merged images H-J). (A) CK, 14xNtr-Ch and NR5xMY-HMY plasmid diagrams. (B-D) The control mCherry reporter (non-NRSE) shows a typical mixed expression pattern with neuronal subsets (C, arrow) and skeletal muscle labeling (D). (E-G) The NRSE-UAS YFP reporter showed expanded expression in skeletal muscle (compare D and G) and a similar pattern in the brain (F, arrow). Note that autofluorescence from iridiphores in the eye is also evident in the YFP emission channel. (H-J) Merged image showing that the addition of NRSE sites to UAS reporter plasmids is not sufficient to restrict reporter expression to the nervous system; i.e., the subset of neurons labeled in the brain (I, arrow). Presumably due to reduced silencing of the NR5xMY-HMY line, there is actually an expansion of YFP reporter expression throughout skeletal muscle.
Image
Figure Caption
Acknowledgments
This image is the copyrighted work of the attributed author or publisher, and
ZFIN has permission only to display this image to its users.
Additional permissions should be obtained from the applicable author or publisher of the image.
Full text @ BMC Biol.

