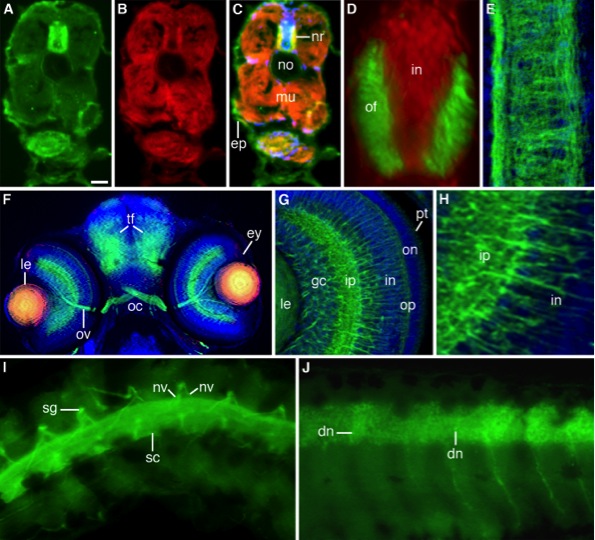
Fig. 6 Immunofluorescent staining of freeze-sectioned 3-day-old (A–H) and whole-mounted 6-day-old (I,J) zebrafish larvae. A–C: Microtubule-stained (A), actin-stained (B), and merged image (C) of a triple stained (DAPI) larva. Microtubules and actin filaments co-distribute in the outer sector of the neural rod (nr) and developing musculature (mu). ep, epidermis; no, empty notochord [Form-Acet]. D: Double-stained (microtubules, green; nuclei, red) merge image of the neural rod showing its inner nuclear (in) and outer fibrillar (of) sectors [Form-Acet]. E: Confocal deconvolved double-stained image (microtubules green, nuclei blue) of a longitudinally sectioned neural rod [Form-Acet]. F: Triple-stained (microtubules, green; β-catenin, red; nuclei, blue) merged image of a coronal section along the head of a larva showing the eye (ey), optic nerve (ov), optic chiasm (oc), and tectal fiber tracts (tf). The central lens (le) cells express β-catenin and microtubules [Form-Acet]. G: Confocal deconvolved merge image of a double-stained (microtubules, green; nuclei, blue) eye showing the retina layers: pt, photoreceptors; on/op, outer nuclear and plexiform layers; in/ip, inner nuclear and plexiform layers; gc, ganglion cell layer; le, lens [Form-Acet]. H: Sector of the same retina showing the inner nuclear (in) and plexiform (ip) layers. I: Spinal cord (sc), nerve roots (nv), and sensory ganglia (sg) stained for microtubules. J: Optical section of a similarly stained spinal cord with developing neurons (dn) [Form-Acet]. Scale bar = 25 μm in A–C, 10 μm in D,E, 35 μm in F, 15 μm in G, 6 μm in H, 25 μm in I,J.
Image
Figure Caption
Acknowledgments
This image is the copyrighted work of the attributed author or publisher, and
ZFIN has permission only to display this image to its users.
Additional permissions should be obtained from the applicable author or publisher of the image.
Full text @ Dev. Dyn.

