
|
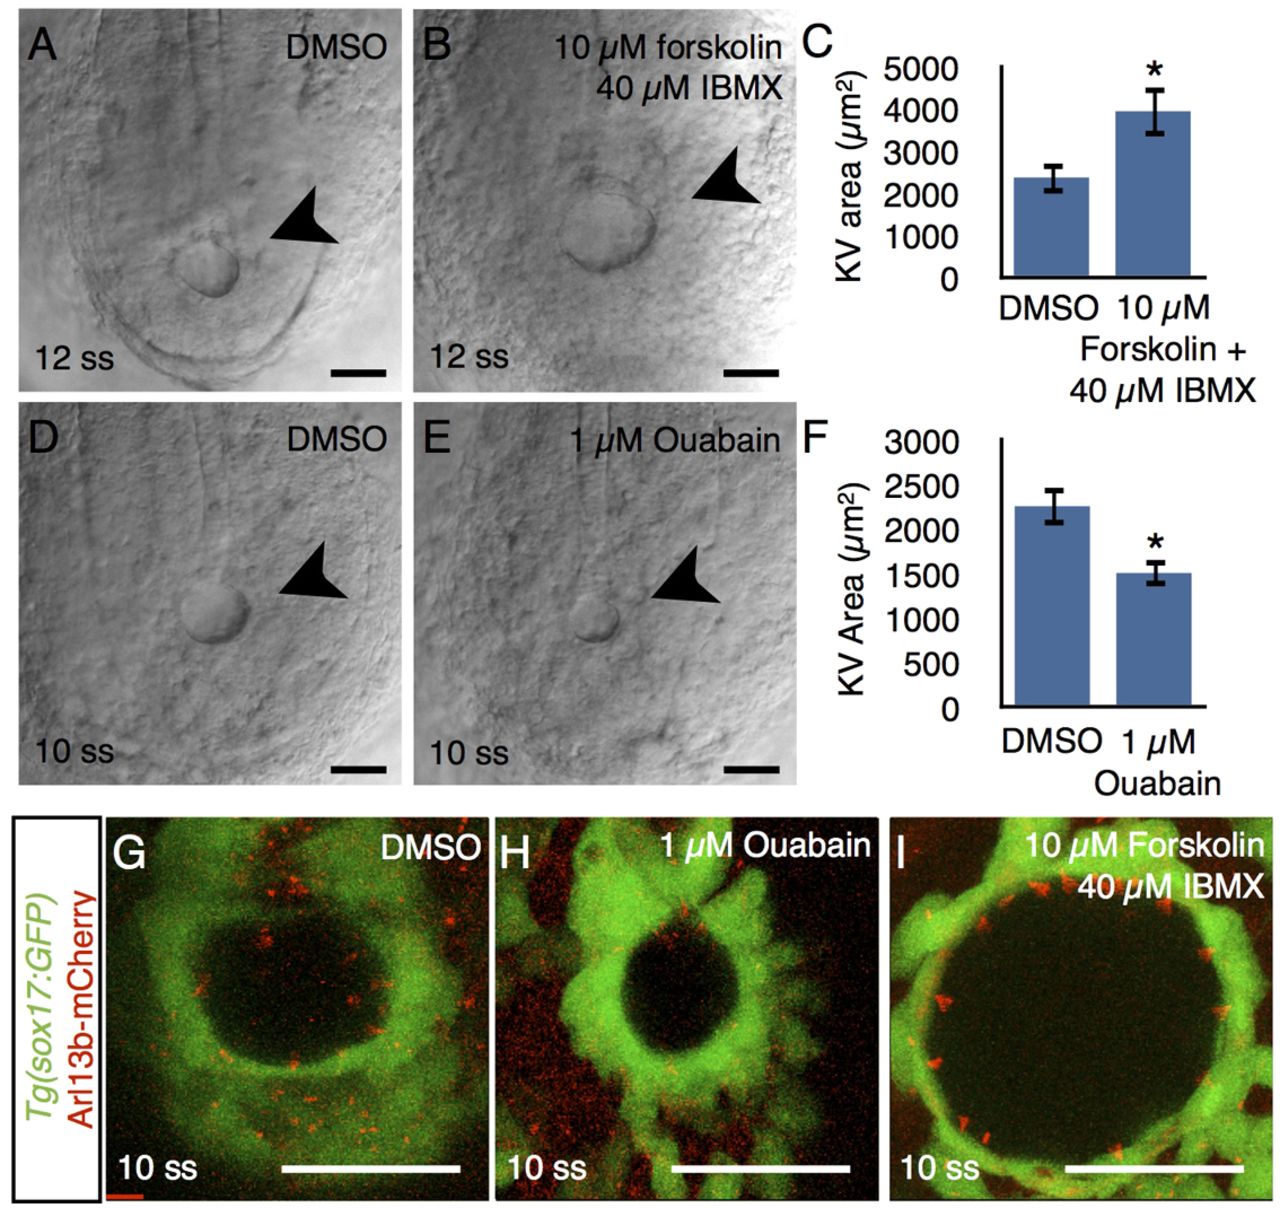
Fig. 7 Fluid secretion regulates KV size. (A,B) DIC imaging of KV (arrowheads) in (A) DMSO control and (B) 10 μM forskolin-, 40 μM IBMX-treated embryos. (C) The KV area of DMSO and treated fish is quantified. DMSO n=15; forskolin + IBMX, n=13; *P<0.01. (D,E) DIC imaging of KV (arrowheads) in (D) DMSO control and (E) 1 μM ouabain-treated embryos at 10 ss. (F) Quantification of KV area in DMSO-and ouabain-treated embryos. DMSO, n=10; ouabain, n=10; *P<0.02. (G-I) Live confocal imaging of Tg(sox17:GFP)-expressing fish treated with (G) DMSO, (H) ouabain or (I) forskolin and IBMX. Error bars represent s.e.m. Scale bars: 50 μm.