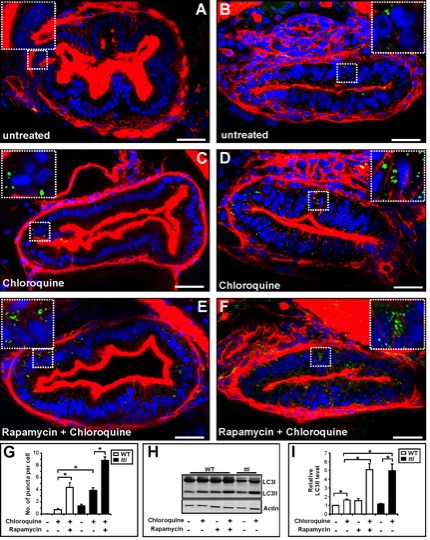
Fig. 5 (A–F) Transverse sections (200 μm) through the intestinal bulb region of untreated WT (A) and ttis450 (B) larvae at 120 hpf or larvae previously treated for 14 h with rapamycin and/or chloroquine (C–F) stained with rhodamine phalloidin to detect F-actin (red), Hoechst 33342 to detect DNA (blue) and the LC3B antibody to detect LC3II–containing autophagosomes (green puncta). (G) The numbers of autophagosomes are increased in chloroquine-treated WT and ttis450 larvae compared to the corresponding untreated larvae. Chloroquine-treated ttis450 larvae contain significantly more puncta than chloroquine-treated WT larvae and similar numbers to WT larvae treated with rapamycin and chloroquine. Rapamycin and chloroquine-treated ttis450 larvae contain significantly more puncta per IEC than the IECs in chloroquine-treated ttis450 larvae and chloroquine and rapamycin-treated WT larvae. Puncta were counted in 20 cells from 3 independent sections using Metamorph. (H) Representative Western blot analysis of whole cell lysates of WT and ttis450 larvae (96 hpf) previously treated for 14 h with rapamycin (10 μM) and/or chloroquine (2.5 μM) using antibodies to LC3B and Actin (loading control). (I) Graphical representation of the data shown in H and two independent analyses. The LC3II signals were quantitated by densitometry. ttis450 larvae treated with chloroquine contain more LC3II than their chloroquine-treated WT siblings and comparable levels to WT larvae treated with rapamycin and chloroquine. Data are represented as mean +/ SD, *p<0.05.
Image
Figure Caption
Figure Data
Acknowledgments
This image is the copyrighted work of the attributed author or publisher, and
ZFIN has permission only to display this image to its users.
Additional permissions should be obtained from the applicable author or publisher of the image.
Full text @ PLoS Genet.

