Fig. 1
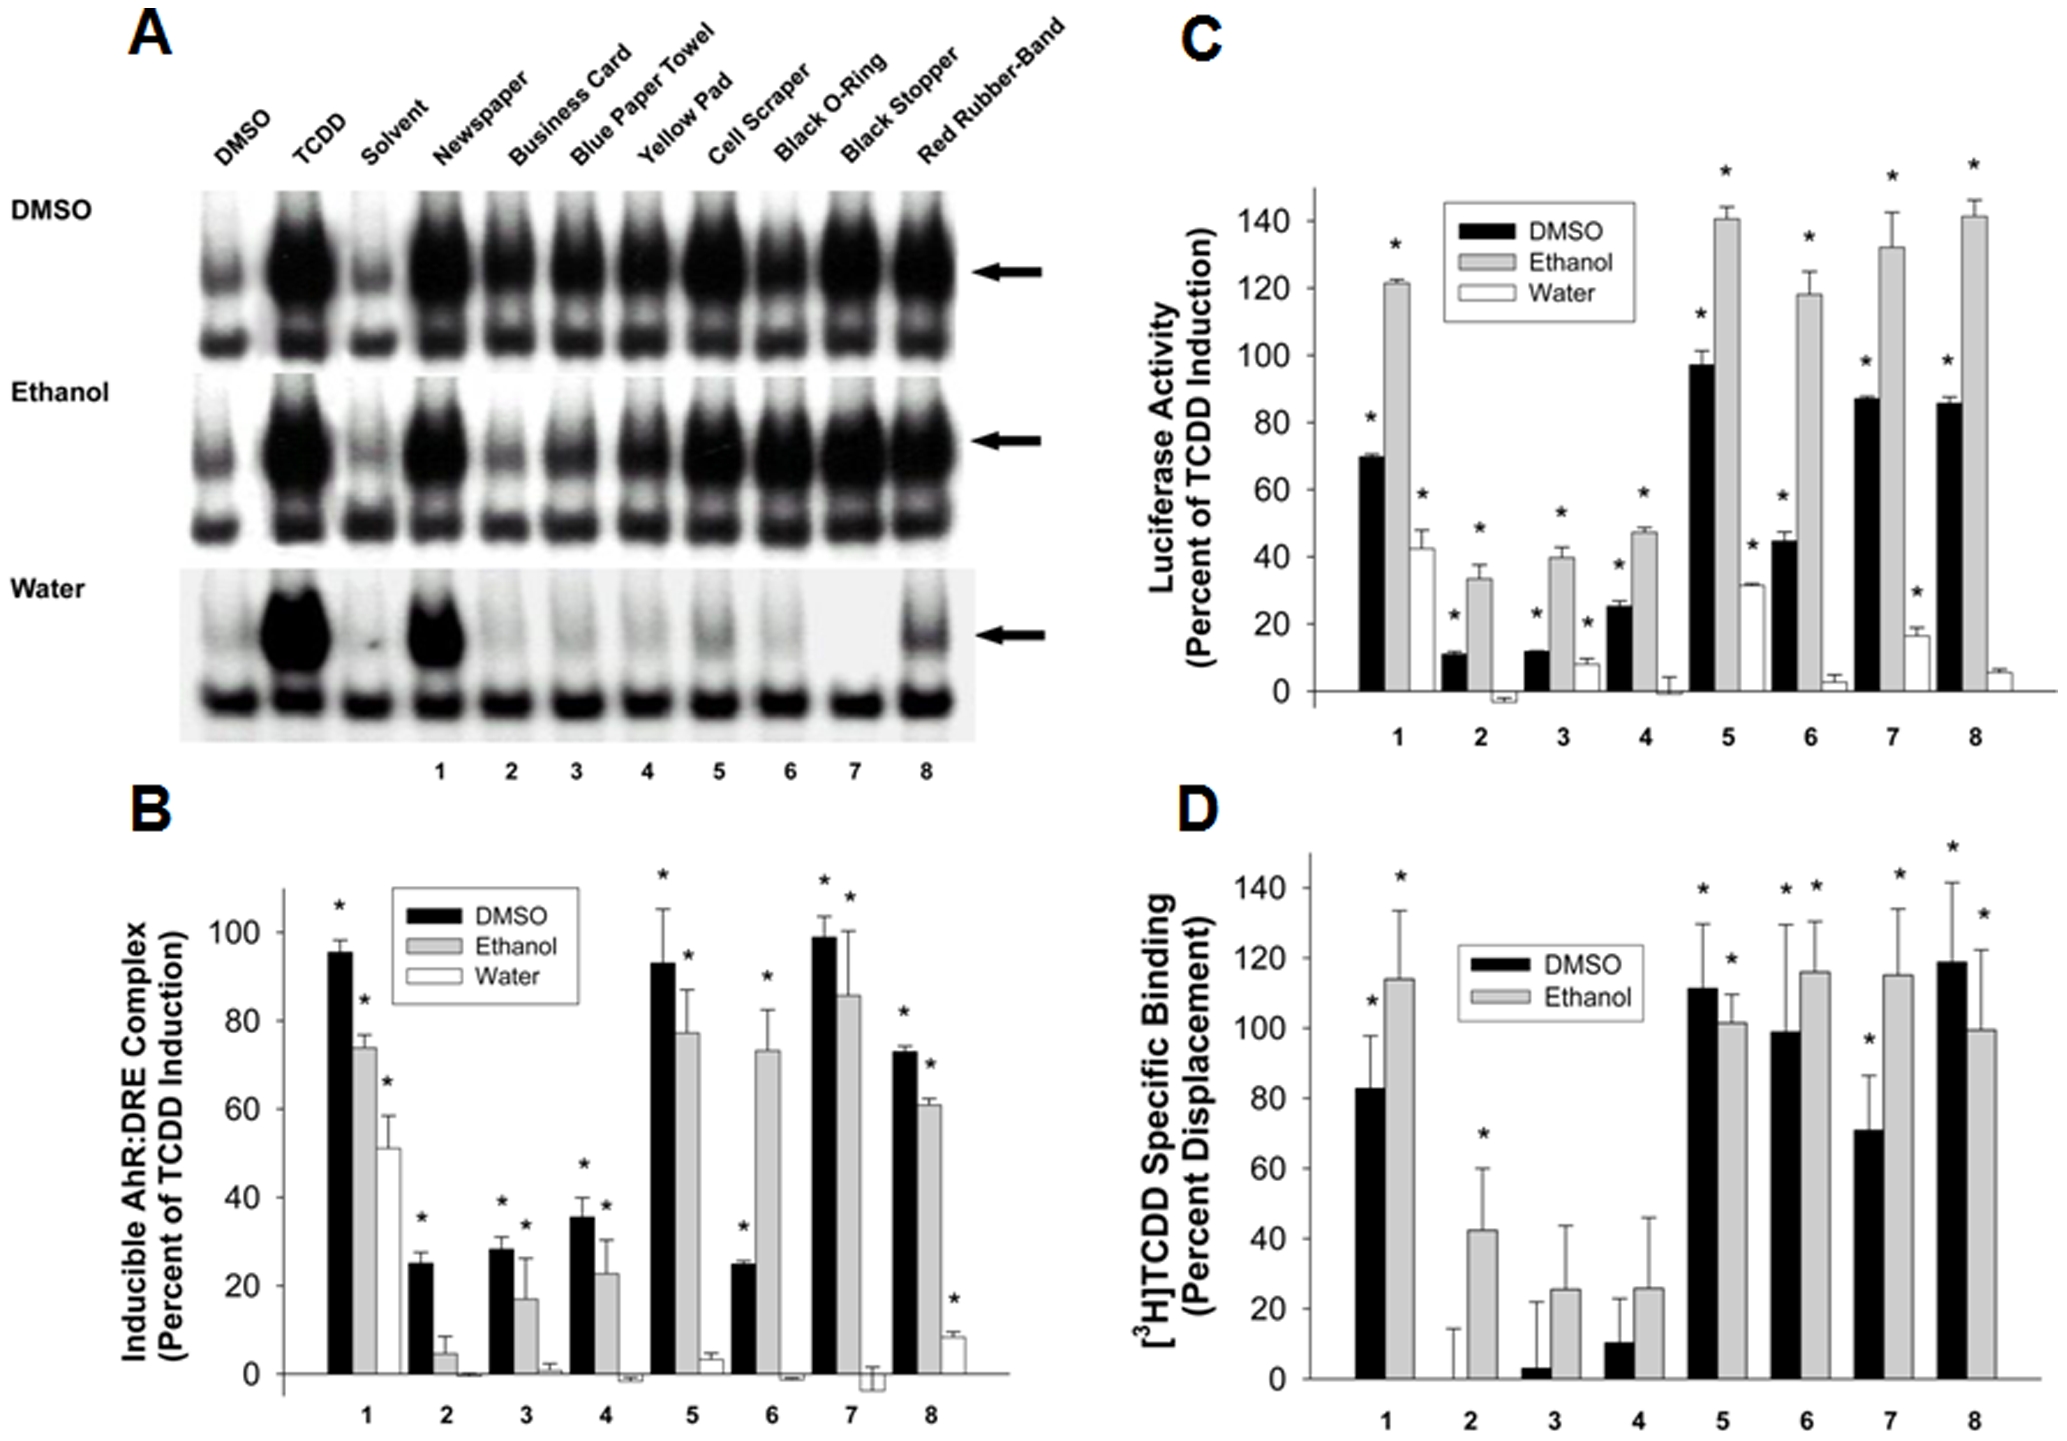
Activation of the AhR and AhR-dependent signal transduction pathway by DMSO, ETOH and water extracts of commercial and consumer products.
The products used in these studies were (1) newspaper (black print section only); (2) business card; (3) blue paper towel; (4) yellow pad; (5) cell scraper; (6) black rubber O-ring; (7) black rubber stopper; (8) red rubber-band. (A) Stimulation of AhR transformation and DNA binding by extracts of the indicated commercial and consumer products in vitro. The arrow indicates the position of the ligand-activated protein-DNA (AhR:ARNT:DRE) complex in the gel retardation assay and results are representative of three individual experiments. (B) The amount of ligand-activated protein-DNA complex formation from gel retardation experiments from part A was determined by phosphorimager analysis. Values are expressed as the percentage of maximal TCDD induction and represent the mean ± SD of all DNA binding data compiled from duplicate gels from three individual experiments. Values significantly different from solvent alone (pd0.05 as determined by the students T-test) are indicated by an asterisk. (C) Induction of luciferase activity by individual extract in recombinant guinea pig (G16L1.1c8) cells. Cells were incubated with the indicated extract (10 μl/ml) for 4 h and luciferase activity determined as described in Materials and Methods. Values are expressed as a percentage of the maximal induction by TCDD and represent the mean ± SD of triplicate determinations and those values significantly different from solvent alone (pd0.05 as determined by the students T-test) are indicated by an asterisk. The results shown are representative of three individual experiments. (D) Competitive binding between [3H]TCDD and the indicated DMSO or ethanol extract for the guinea pig hepatic cytosolic AhR. Guinea pig cytosol was incubated with 2 nM [3H]TCDD in the absence or presence of the indicated extract for 2 h at 20°C, and specific binding of [3H]TCDD was determined by hydroxyapatite binding. Values represent the mean ± SD of triplicate determinations and are representative of three individual experiments and those values significantly different from solvent alone (pd0.05 as determined by the students T-test) are indicated by an asterisk.

