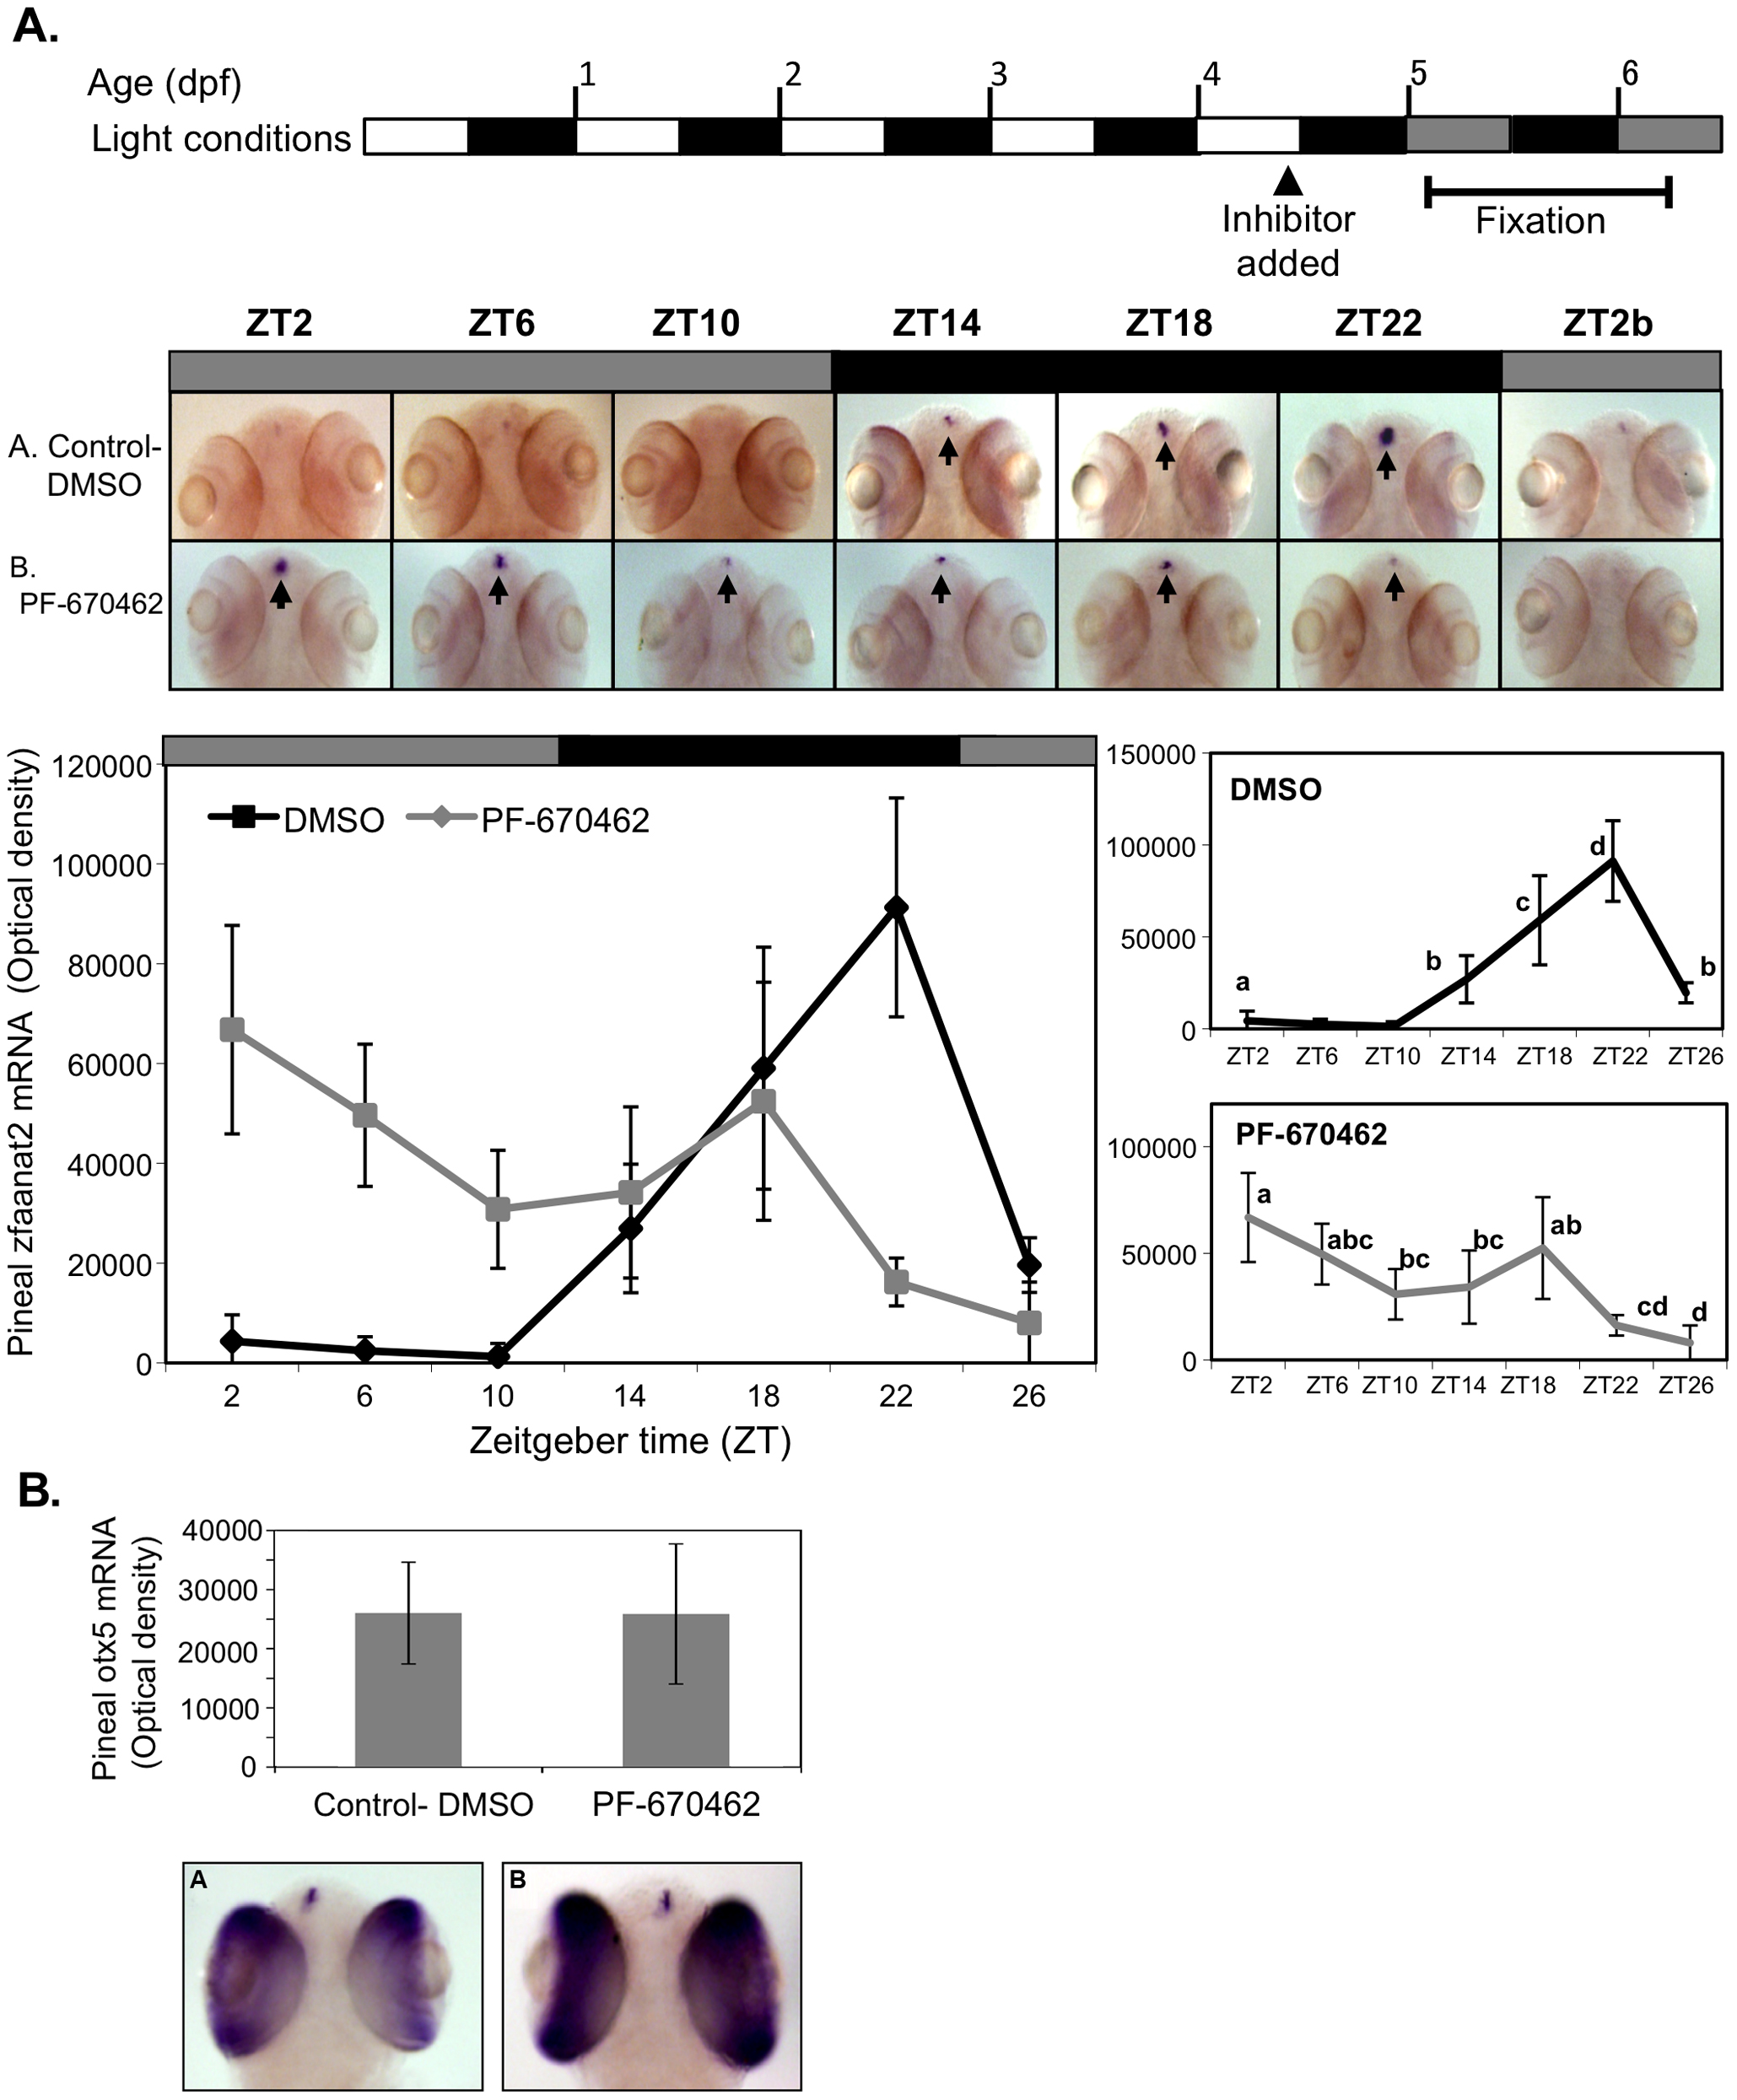
Fig. 5 CK1δ inhibition abolishes rhythmic pineal aanat2 mRNA expression. A. Top panel: Schematic representation of the experimental design. The horizontal bars represent the light conditions before and during sampling; white boxes represent light, grey boxes represent subjective day and black boxes represent dark. Middle panel: Whole-mount ISH signals for aanat2 mRNA (dorsal views of the heads) of representative specimens treated with DMSO (control, a) or with PF-670462 (5 μM) (a). Zeitgeber times (ZT) are indicated for each sample. ZT0 corresponds to “lights-on,” ZT12 to “lights-off”. ZT2b refers to the second day of the experiment. ISH signals in the pineal gland are indicated by arrows. Bottom chart: Quantification of signal intensities in the pineal glands of control (DMSO) larvae (black line) and PF-670462-treated larvae (grey line). Values represent the mean ± SE optical densities of the pineal signals. Aanat2 mRNA expression is significantly affected by treatment and sampling times (P<0.01 by two way ANOVA). Differences in sampling time within each treatment were determined by one-way ANOVA followed by Tukey′s post-hoc test for each treatment. B. Whole-mount ISH signals for otx5 mRNA at ZT2. Photographs of pineal signals in (a) DMSO (control) and (b) CK1δ-treated larvae are presented in the bottom panel.
Image
Figure Caption
Figure Data
Acknowledgments
This image is the copyrighted work of the attributed author or publisher, and
ZFIN has permission only to display this image to its users.
Additional permissions should be obtained from the applicable author or publisher of the image.
Full text @ PLoS One

