Image
Figure Caption
Fig. 6
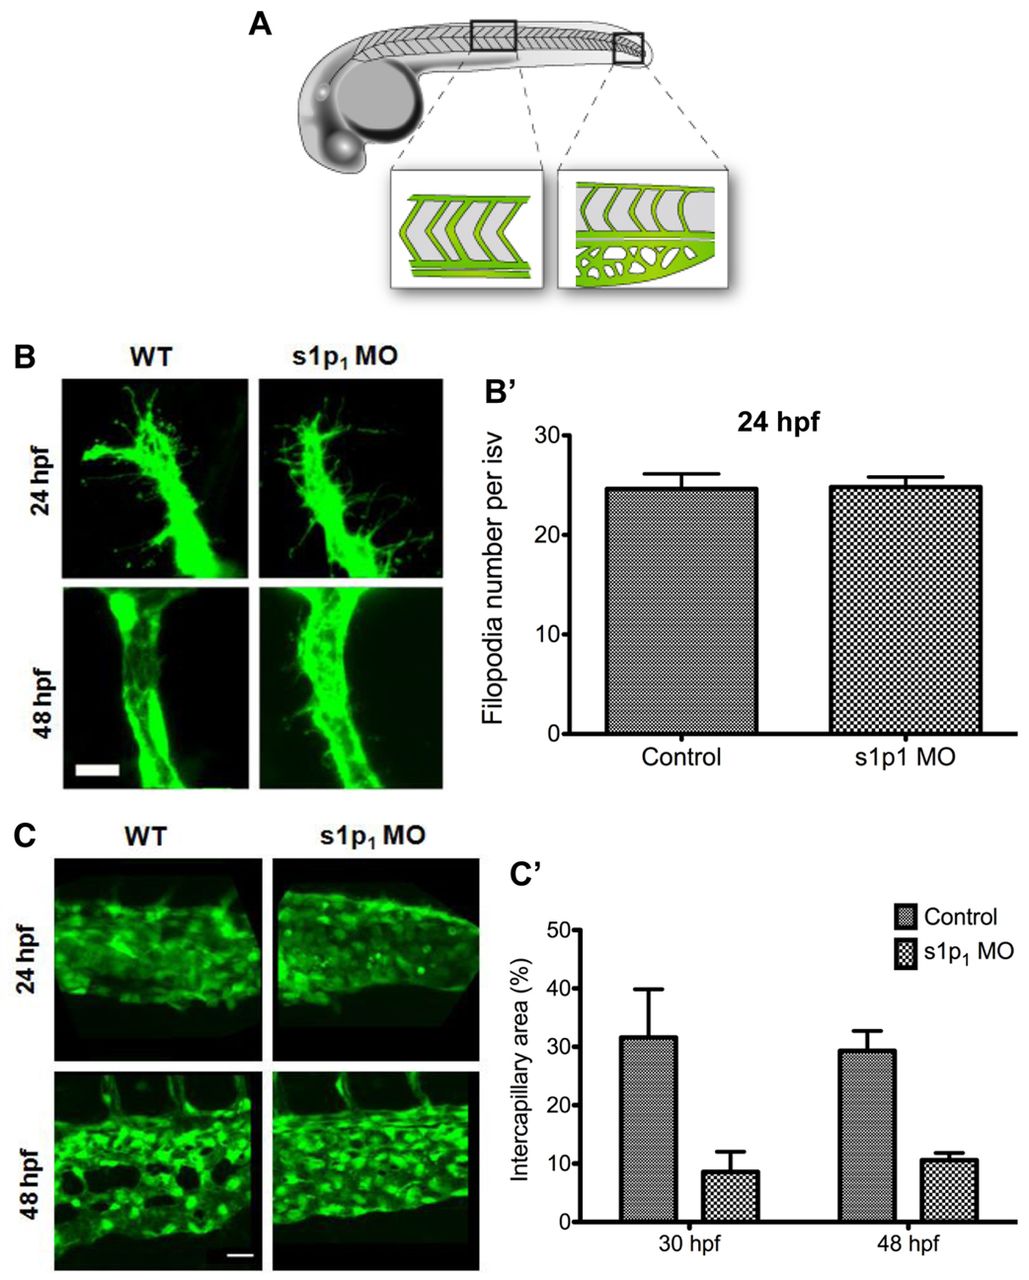
s1p1 MO embryos exhibit remodeling defects in the ISV and CVP. (A) Schematic showing the anatomical location of the areas shown in B and C. (B,C) Fluorescence microscopy of the ISV (B) and CVP (C) regions in WT and s1p1 MO Tg(fli-egfp)y1 zebrafish embryos at 24 and 48 hpf. (B2) Graph showing comparable filopodia numbers in ISV of WT and s1p1 MO zebrafish (nwt=11, ns1p1MO=16, P=0.92). (C2) Graph showing comparison of the intercapillary area in the CVP between WT and s1p1 MO zebrafish (nwt=7, ns1p1 MO=7, P=0.002, error bars represent s.e.m.). Scale bars: in B, 10 μm; in C, 20 μm.
Figure Data
Acknowledgments
This image is the copyrighted work of the attributed author or publisher, and
ZFIN has permission only to display this image to its users.
Additional permissions should be obtained from the applicable author or publisher of the image.
Full text @ Development

