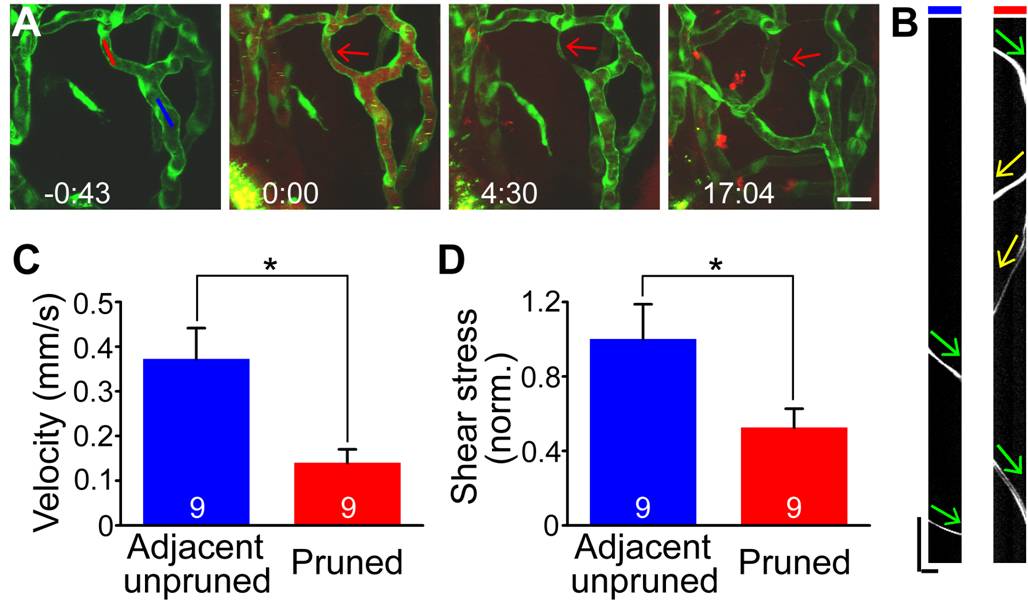
Fig. S10 Measurement of plasma flow velocity and its relationship with the occurrence of vessel pruning. (A) Serial images showing a vessel pruning event in the midbrain vasculature of a 2-dpf Tg(kdrl:eGFP) larva, which received microinjection of Fluosphere with green fluorescence (0.5 μm in diameter) into its circulation system. Fluosphere (green) and Dextran (red fluorescence, 10,000 MW) were co-injected into the circulation between –0:43 (hour:minute) and 0:00. The red and blue lines in the first panel indicate the site where axial line scanning was performed on a pruned (red arrow) and its adjacent unpruned segments, respectively. Scale, 20 μm. (B) Fluosphere-based kymographs showing bi-directional plasma flow in the pruned segment (right) and uni-directional flow in its adjacent unpruned segment (left). Scales, 5.43 μm (x-axis), 77.78 ms (y-axis). (C and D) Fluosphere-based calculation of plasma flow velocity (C) and shear stress (D) in pruned (red) and its adjacent unpruned segment (blue). The number on the bar represents the number of vessel segments examined. * p<0.05 (Student′s t test). Error bars, ± SEM.
Image
Figure Caption
Acknowledgments
This image is the copyrighted work of the attributed author or publisher, and
ZFIN has permission only to display this image to its users.
Additional permissions should be obtained from the applicable author or publisher of the image.
Full text @ PLoS Biol.

