
|
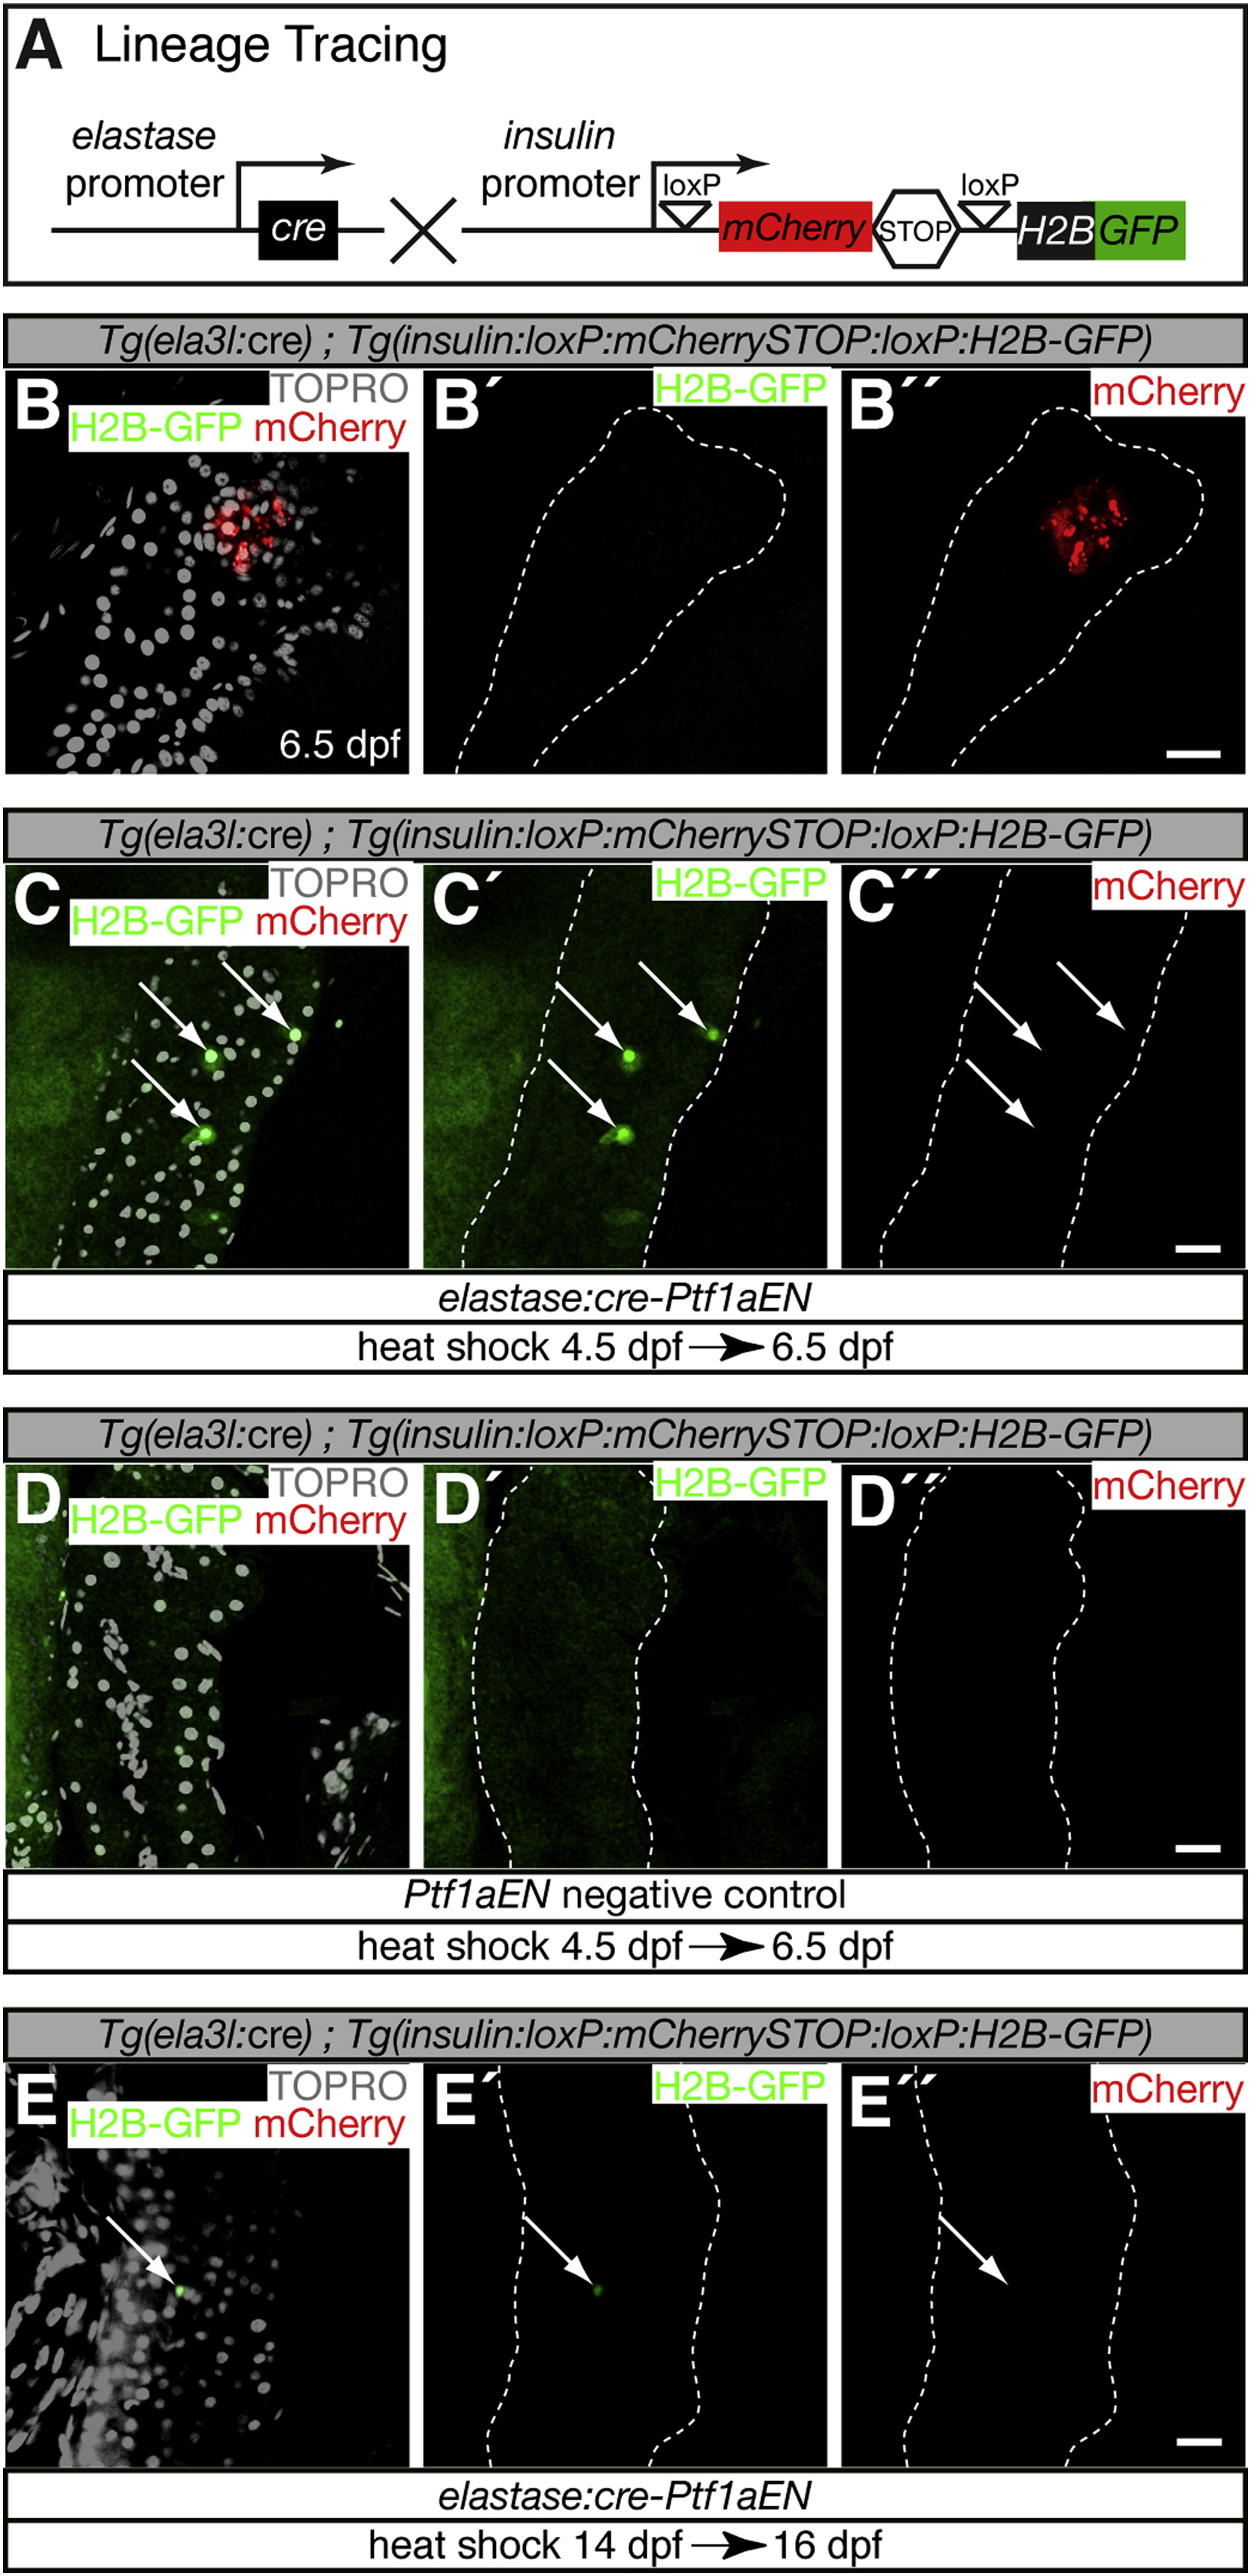
Fig. 4
Genetic Lineage Tracing of Acinar to insulin+ Cell Fate Conversion (A) Tg(ela3l:cre);Tg(insulin:loxP:mCherrySTOP:loxP:H2B-GFP) lineage tracing. Expression of Cre in acinar cells excises the mCherry-STOP cassette and permits expression of H2B-GFP in cells that activate the insulin promoter. (B–E3) Confocal sections through pancreata marked with fluorescent transgenes and TO-PRO to mark DNA. Scale bars represent 20 μm. (B–B3) Tg(ela3l:cre);Tg(insulin:loxP:mCherrySTOP:loxP:H2B-GFP) did not mark any pancreatic cells in wild-type animals. (C–D3) elastase:cre-Ptf1aEN expression induced scattered H2B-GFP-positive cells throughout the pancreatic domain (arrows) (C–C3), which were not induced in Ptf1aEN-negative controls (D–D3). (E–E3) elastase:cre-Ptf1aEN expression induced isolated H2B-GFP-positive cells at 14 dpf (arrow). See also Figure S2.