Image
Figure Caption
Fig. S3
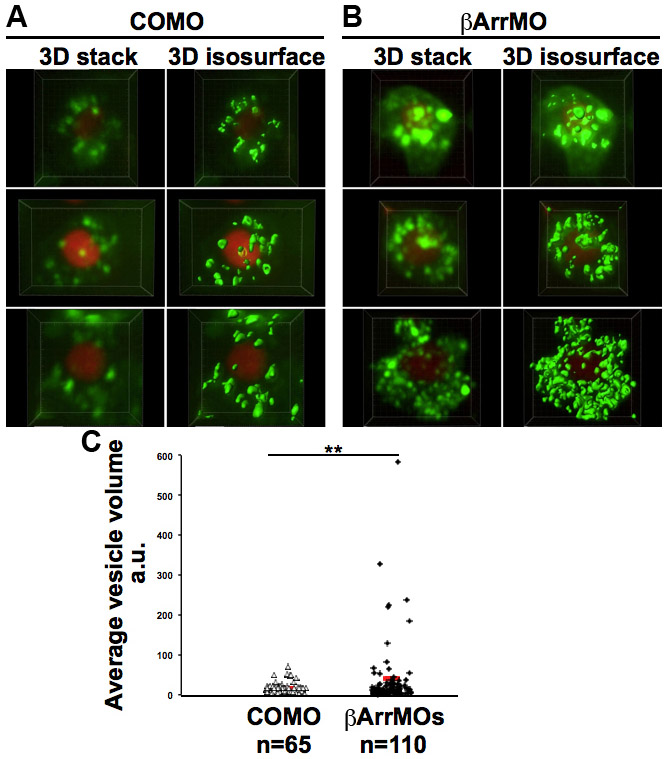
Difference in size of Cxcr7b foci in control cells and cells knocked down for β-arrestin function. (A,B) Original 3D stacks and their 3D surface rendering (3D isosurface) performed using Imaris software on six different cells. Embryos were injected with EGFP-Cxcr7b and H2B-mCherry mRNAs and either control (A) or β-arrestin (B) MOs; cells were imaged at 8-9 hpf. (C) The average size of vesicles in the cells shown in A and B. **P<0.05, Student’s t-test; n, number of vesicles analyzed.
Acknowledgments
This image is the copyrighted work of the attributed author or publisher, and
ZFIN has permission only to display this image to its users.
Additional permissions should be obtained from the applicable author or publisher of the image.
Full text @ Development

