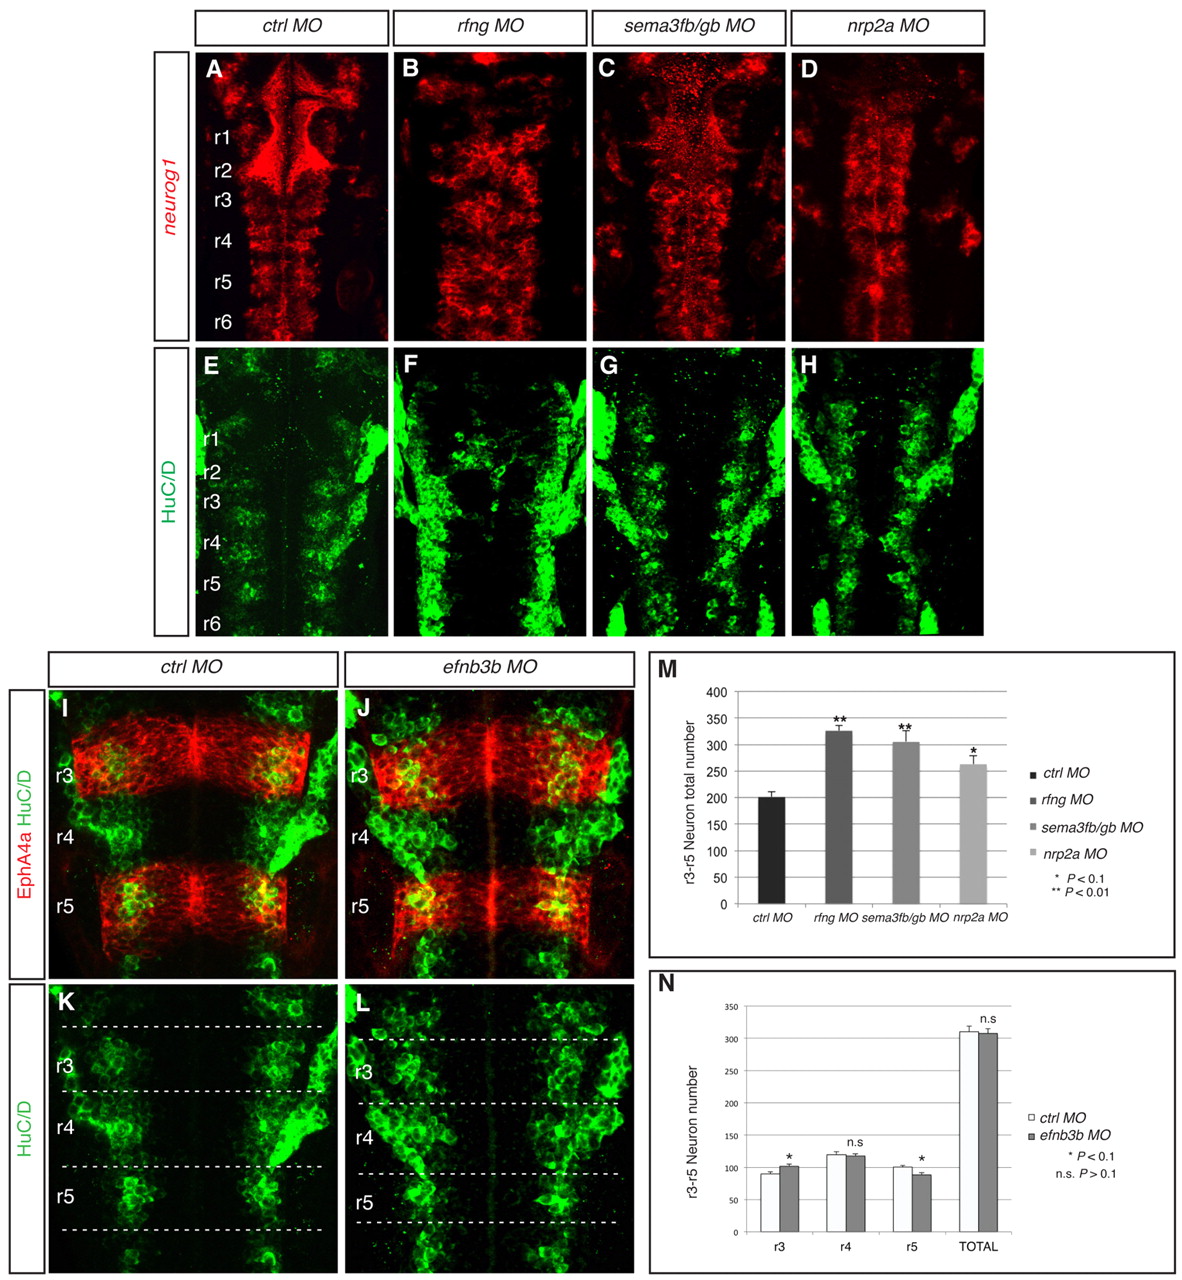
Fig. 5 Mispositioning of fgf20a neurons affects the patterning and amount of neurogenesis. (A-H,M) Expression at 30 hpf of neurog1, which marks differentiating neurons in the neural epithelium (red), and HuC/D, which marks neurons in the mantle zone (green), in embryos injected with control MO (A,E), rfng MO (B,F), sema3fb+sema3gb MOs (C,G) or nrp2a MO (D,H). Knockdown of rfng (85%, n=14), sema3fb+sema3gb (65%, n=23) or nrp2a (59%, n=17) leads to disorganisation of the neurogenic zones. (M) Quantitation of the number of HuC/D-expressing cells in r3 to r5 in control MO embryos (201±9.7 neurons, n=4) reveals that these increase following knockdown of rfng (326±16.2 neurons, n=4; P=0.008), sema3fb+sema3gb (306±9.4 neurons, n=4; P=0.001) or nrp2a (263±9.4 neurons, n=4; P=0.06). (I-L,N) HuC/D-expressing neurons (green) combined with EphA4 antibody staining (red) at 30 hpf in control (L,K) and efnb3b (J,L) knockdown embryos. (N) Quantitation of neurons in both conditions in r3, r4 and r5 separately plus total number. There is a significant increase in the number of neurons in r3 (control MO 90±2.7, n=5, versus efnb3b MO 101±3.1; P=0.09), a decrease in r5 (control MO 100±2.7, n=5, versus efnb3b MO 88±3.5; P=0.06), but no significant change in r4 (control MO 120±4.6, n=5, versus efnb3b 118±3.3; P=0.74). The total number of neurons is not significantly different (control MO 310±9.1, n=5, versus efnb3b 307±7.2; P=0.85). The orientation of embryos is as in Fig. 1.
Image
Figure Caption
Figure Data
Acknowledgments
This image is the copyrighted work of the attributed author or publisher, and
ZFIN has permission only to display this image to its users.
Additional permissions should be obtained from the applicable author or publisher of the image.
Full text @ Development

