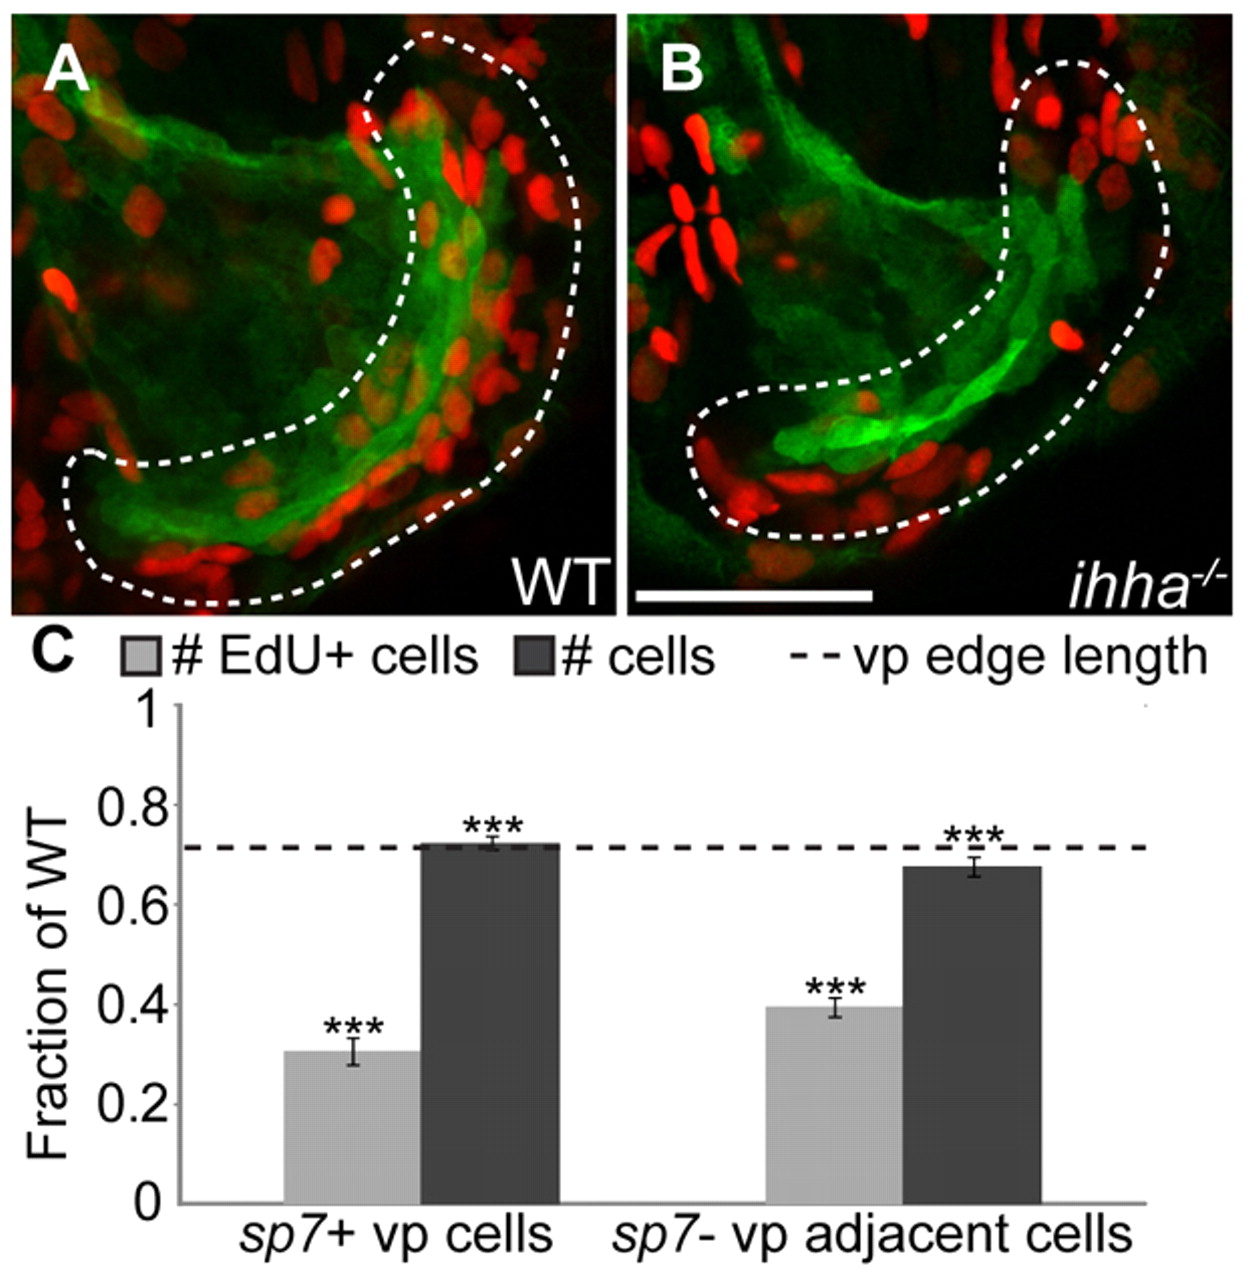
Fig. 4 ihha controls cell proliferation. Quantitation of cell proliferation in ihha mutants and wild-type siblings. Images are lateral views with dorsal upwards and anterior towards the left. (A,B) Confocal projections of the Op at 5 dpf showing sp7:EGFP-expressing osteoblasts (green) and EdU-positive (EdU+) cells (red). (A) EdU+ cells are mostly found along the actively growing vp edge in wild type. (B) Fewer EdU+ cells are apparent along the vp edge in ihha mutants. Scale bar: 50 μm. (C) Quantitation of EdU+ cells along the vp edge as a fraction of wild-type levels shows that the amount of EdU+ cells is significantly decreased in ihha mutants. Cells included in the count, represented by dashes in A and B, are those within two cell diameters of the vp edge that express sp7:EGFP (sp7+ vp cells) or those that do not (sp7–, vp adjacent cells). The number of total cells stained with SYTO-59 was counted with the same parameters in a separate experiment and is decreased to a lesser extent than the number of EdU+ cells, but proportional to the decrease in vp edge length (shown as a broken line and based on Fig. 3). Data are presented as mean±s.e.m., ***P<0.001 by unpaired t-test, ne10 per genotype.
Image
Figure Caption
Figure Data
Acknowledgments
This image is the copyrighted work of the attributed author or publisher, and
ZFIN has permission only to display this image to its users.
Additional permissions should be obtained from the applicable author or publisher of the image.
Full text @ Development

