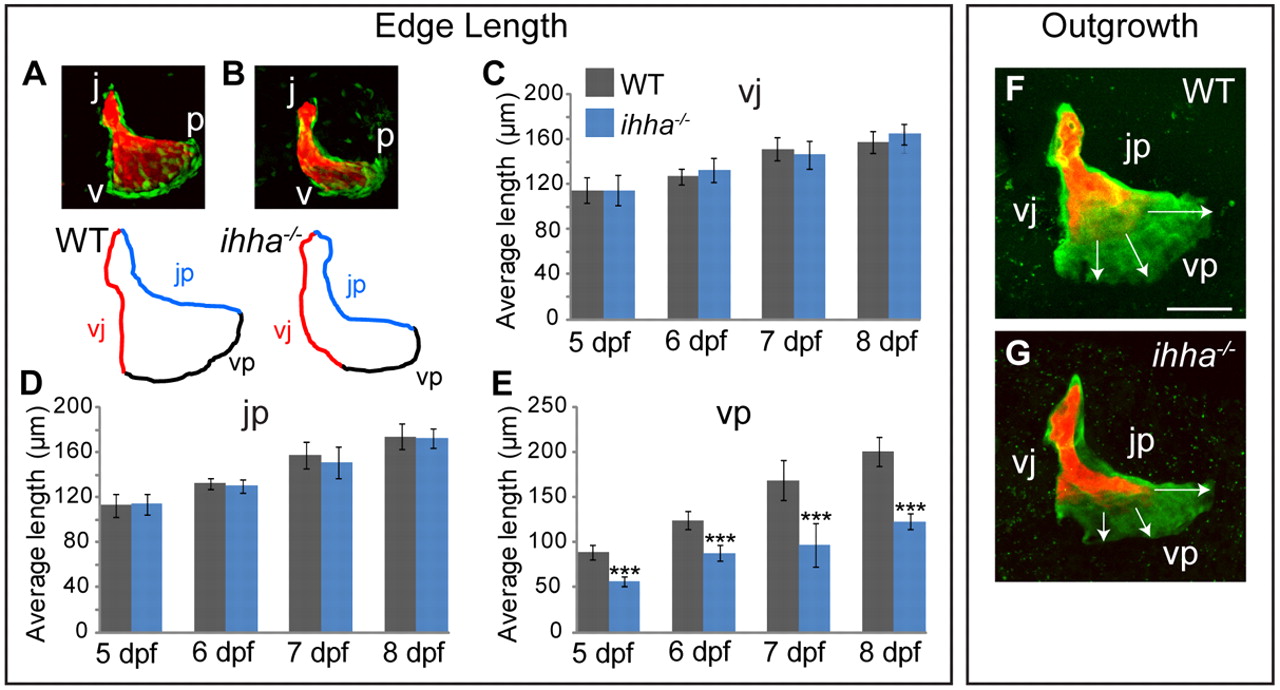
Fig. 3 Growth along the vp edge is regulated by ihha. Quantitation of Op edge lengths and outgrowth. Images are lateral views with dorsal upwards and anterior towards the left. (A,B) Images and drawn outlines of the 7 dpf Op showing the vj, jp, and vp edges as defined by Alizarin Red and sp7:EGFP-expressing osteoblast localization (see Fig. 1). (C-E) vp edge length is significantly reduced in ihha mutants (E), whereas jp (D) and vj (C) edge lengths are unchanged. (F,G) Double labeling of the Op at 5 dpf with Alizarin Red and at 8 dpf with calcein (green) indicates specifically reduced ventral Op outgrowth in ihha mutants. Data are presented as mean±s.d., ***P<0.001 by unpaired t-test, ne7 per genotype/timepoint. Images in F and G are representative of ne6 larvae per genotype. v, ventral apex; p, posterior apex; j, joint apex; vp, edge connecting v and p; vj, edge connecting v and j; jp, edge connecting j and p. Scale bar: 50 μm.
Image
Figure Caption
Figure Data
Acknowledgments
This image is the copyrighted work of the attributed author or publisher, and
ZFIN has permission only to display this image to its users.
Additional permissions should be obtained from the applicable author or publisher of the image.
Full text @ Development

