
|
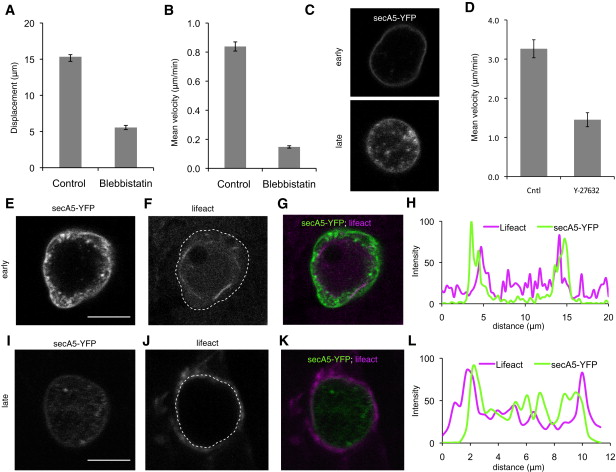
Fig. 2 Apoptotic Cells Exhibit Internal Actin Remodeling(A and B) Quantification of displacement and velocity of apoptotic cells showing strong reduction in both parameters in cpt/blebbistatin versus cpt-only treated animals. Animals were treated with camptothecin (cpt) alone (left) or cotreated with cpt and blebbistatin (right). Images of blebbistatin-treated animals show reduced motility compared to animals treated only with cpt.(C) Images of motile, blebbing (early) and round, patchy (late) secA5-YFP+ cells.(D) Quantification of velocity of apoptotic cells in control and Y-27632 (250 μM)-treated animals.(E–H) Representative early apoptotic cell positive for cortical F-actin as indicated by Lifeact fluorescence. This shows high fluorescence inside the apoptotic cell as determined by the boundary of the annexin signal. Note actin bundles within the cell in (F).(I–L) Representative late stage apoptotic cell showing high external Lifeact fluorescence surrounding the apoptotic cell, likely within surrounding cells.(H and L) Quantification of relative fluorescence intensity for secA5-YFP (green) and Lifeact (purple) along a line drawn through the center of the early (H) and late (L) apoptotic cells. Lifeact fluorescence is primarily interior to the annexin signal in early cells and exterior to the annexin signal in late cells. Dotted lines in (F) and (J) indicate outer edge of the cell (as determined by secA5-YFP signal). Scale bars represent 5 μm (E and I). Data are represented as mean ± SEM.