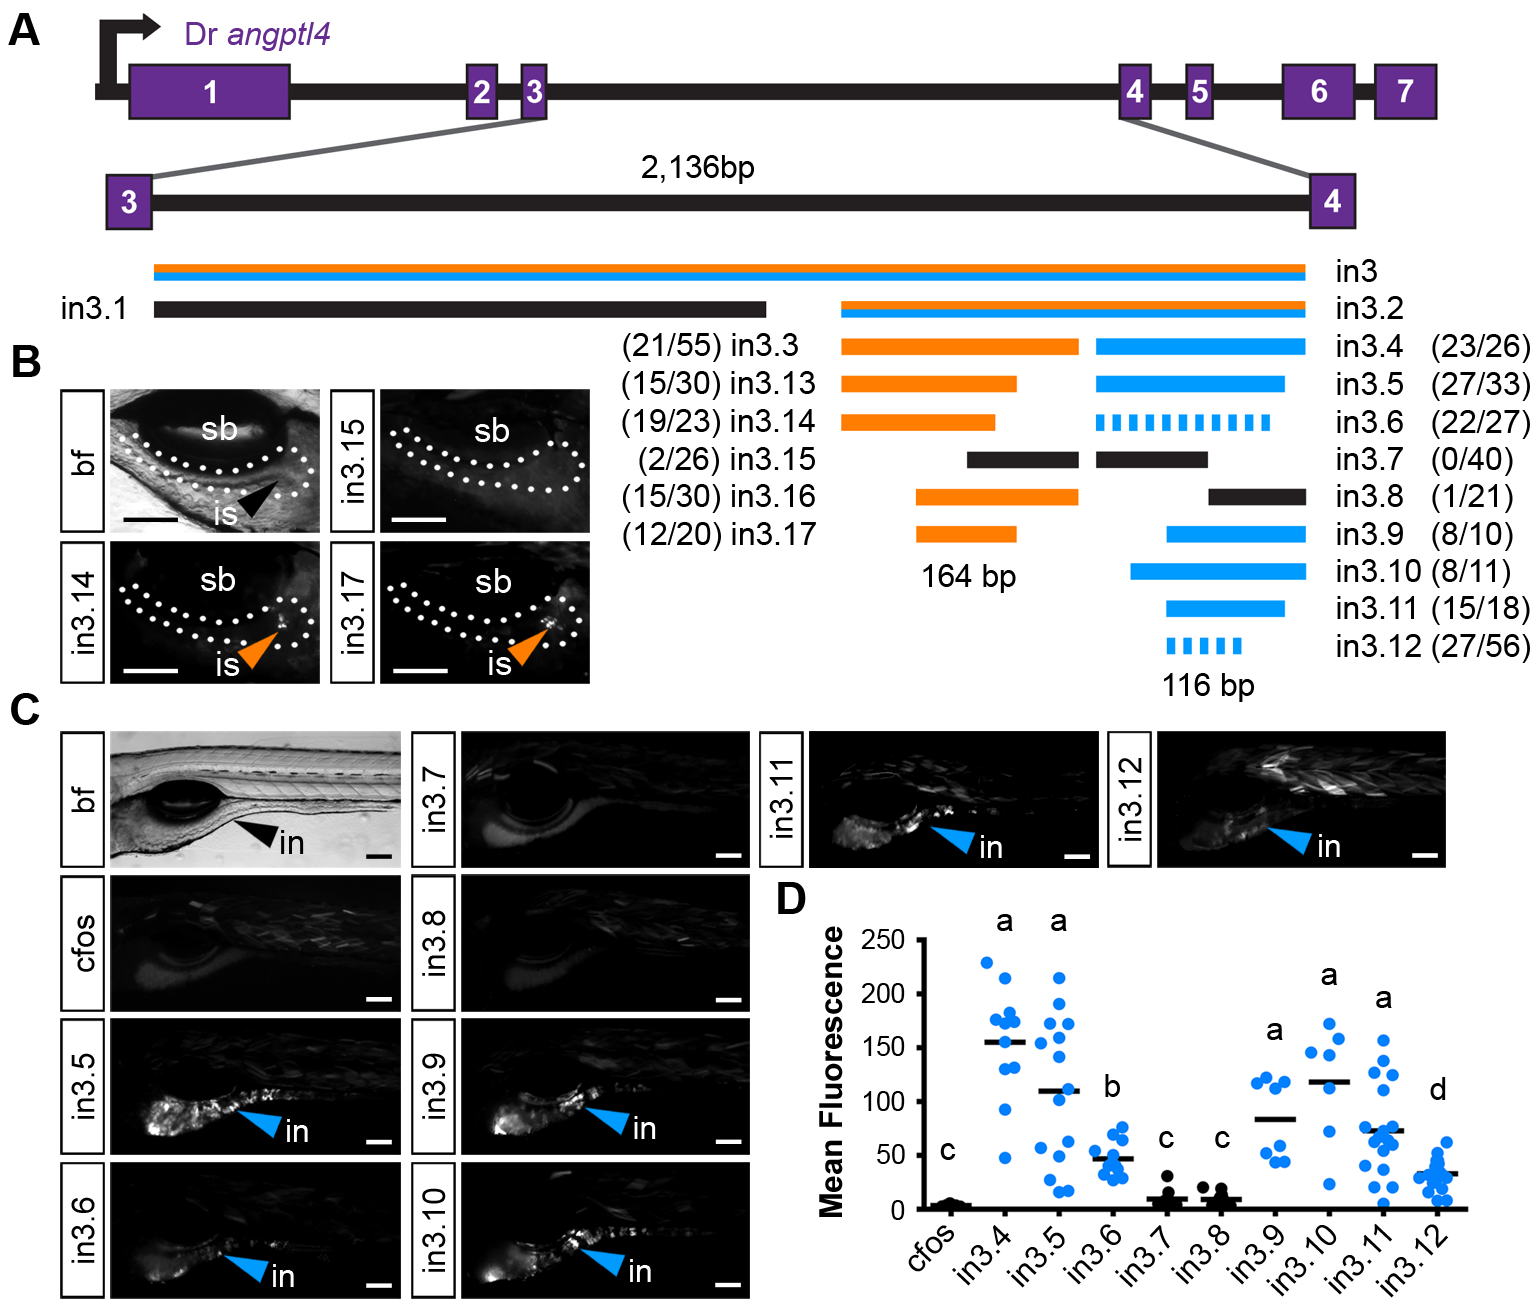
Fig. 5
Truncation mapping of the islet and intestinal regulatory module.
(A) Scaled schematic of the zebrafish angptl4 locus showing annotations of truncations assayed for regulatory potential. Orange lines indicate sufficiency to confer islet expression, blue lines indicate sufficiency to confer intestinal expression, and black lines indicate insufficiency in intestine and islet. Dashed blue lines indicate reduced intestinal expression compared to in3.4. Ratios of islet or intestine positive fish versus total fish expressing gfp are shown in parentheses next to truncation labels. (B) Representative images of islet views from mosaic injected fish of each truncation construct. Orange arrows mark islet expression (is). Scale bars = 100 µm. (C) Representative images of intestinal views from mosaic fish injected with each truncation construct. Blue arrows mark intestinal expression (in). Scale bars = 100 μm. (D) Relative mean intestinal fluorescence within the intestine was quantified in mosaic animals (see Materials and Methods) and plotted per injected fish. Circles represent mean fluorescence averaged for three mosaic patches within one fish, and are colored blue or black to designate truncations that are sufficient or insufficient to confer intestinal expression, respectively. Statistical significance was tested using Kruskal-Wallis one-way analysis of variance (labels: a = P<.001, b = P<.05 vs. Fos; c = P<.001, d = P<.01 vs. in3.4). Scale bars = 100 μm.

