
|
Fig. S2
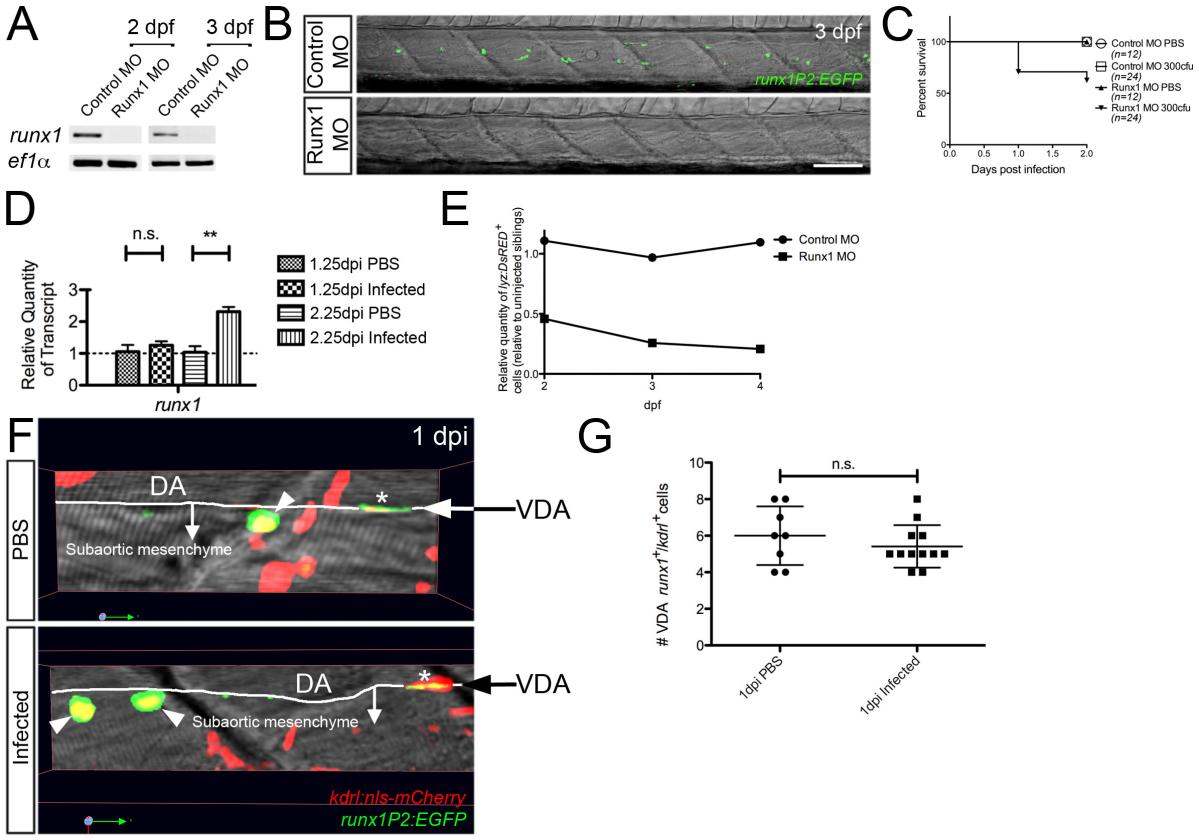
(A) RT-PCR detection of disrupted runx1 splicing at 2 and 3 dpf following Runx1 MO injection. (B) Confocal images through the AGM of control MO- and Runx1 MO-injected Tg(runx1P2:EGFP) larvae at 3 dpf. (C) Survival graph of control MO injected/PBS (n=12), control MO injected/300 cfu infected (n=24), Runx1 MO injected/PBS (n=12) and Runx1 MO injected/300 cfu infected (n=24). (D) QPCR analysis of runx1 expression at 1.25 and 2.25 dpi, relative to PBS controls, means standard ± errors. (E) Effect of Runx1-depletion on steady-state granulopoiesis. Relative quantities of whole-larvae fluorescent cells, as determined by flow cytometry, within Tg(lyz:DsRED) larvae at 2, 3 and 4 dpf following injection of control and Runx1-targeting MOs, relative to uninjected siblings. (F) Confocal imaging through the AGM region of PBS control and Infected Tg(runx1P2:EGFP)/Tg(kdrl:nls-mCherry) larvae (1 dpi) revealing no significant change in the number of VDA-localized dual fluorescent (runx1+kdrl+) putative hemogenic endothelial cells (G), marked with asterisks. Arrowheads mark dual-labeled subaortic HSPCs. All views, anterior to left. Scale bar, 50m in B. Abbreviations: n.s., not significant; DA, dorsal aorta; VDA, ventral dorsal aorta; **, p-value<0.01.