
|
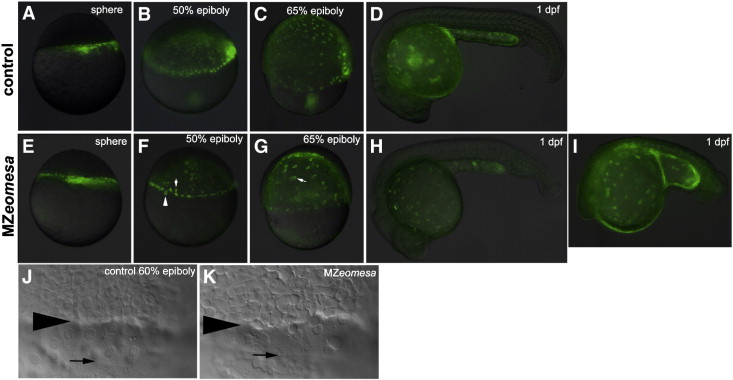
Fig. 4 Epiboly progression is normal in MZeomesa embryos. (A-I) Overlays of fluorescent and brighfield images of control (A-D) and MZeomesa (E-I) embryos injected into the YSL with fluorescent histone to highlight the YSN. Stages as indicated. (F) Arrowhead and arrow indicate abnormally large and small nuclei, respectively. (G) Arrow indicates cluster of clumped nuclei not visible in the control embryo in (C). Wild type (H) and abnormal looking (I) MZeomesa embryos at 1 dpf have intact YSLs (J,K) DIC images of the margin of 60% epiboly control (J) and MZeomesa (K) embryo. Arrowhead indicates deep cell margin, arrow indicates EVL margin.
Reprinted from Developmental Biology, 362(1), Du, S., Draper, B.W., Mione, M., Moens, C.B., and Bruce, A.E., Differential regulation of epiboly initiation and progression by zebrafish Eomesodermin A, 11-23, Copyright (2012) with permission from Elsevier. Full text @ Dev. Biol.