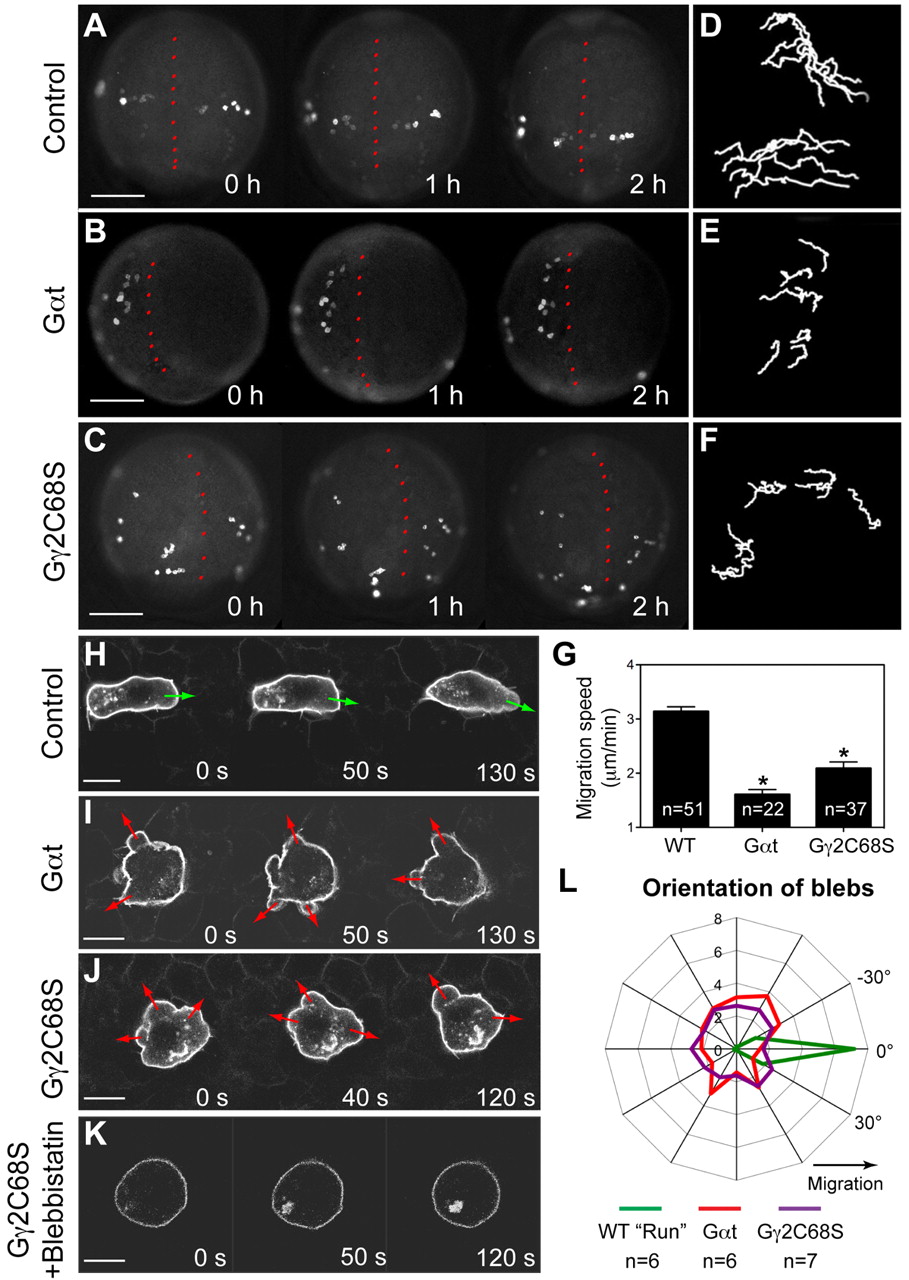
Fig. 2 Gβγ signaling regulates the motility and polarity of PGC migration. (A-G) Epifluorescence time-lapse experiments performed on Tol-kop-EGFP-F-nos1-3′UTR embryos, with PGCs expressing membrane-bound GFP (memGFP) at low magnification (5× objective) at 8-10 hpf (supplementary material Movie 1). (A-C) Snapshots from time-lapse movies. Dorsal view; red dotted line indicates the notochord. (D-F) Representative tracks delineate PGC migration routes. (G) Average migration speed of PGCs. *P<0.01 versus control. Data are mean+s.e.m. (H-L) Confocal time-lapse imaging of PGCs expressing memGFP, taken at 8-10 hpf (supplementary material Movie 2). (H-K) Snapshots from movies of the control PGCs during the run phase (H) (green arrows indicate protrusion at the leading edge); Gαt- or Gγ2C68S-expressing PGCs (I,J) (red arrows indicate bleb-like protrusions); PGCs expressing Gγ2C68S in embryos treated with blebbistatin (K). Scale bars: 200 μm in A-C; 10 μm in H-K. (L) Orientation of blebs relative to the direction of PGC migration, as analyzed from four independent movies per group (10-second intervals, blebs grouped into 15° sectors).
Image
Figure Caption
Figure Data
Acknowledgments
This image is the copyrighted work of the attributed author or publisher, and
ZFIN has permission only to display this image to its users.
Additional permissions should be obtained from the applicable author or publisher of the image.
Full text @ Development

